Starting with the HetrixTools Agent v1.05, you can define up to 10 services to be constantly monitored by our agent on your server.
To configure this in your Agent, please follow the instructions below, (a) or (b):
a) Setting the services you wish to monitor during the HetrixTools Server Agent installation:
- Install the agent from your Uptime Monitoring dashboard:

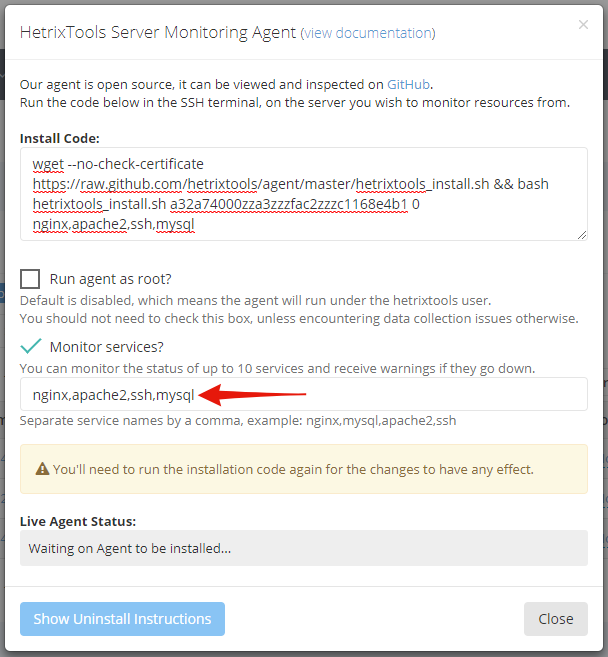
- On the “Install Code” pop-up, be sure to check “Monitor Services”:

- And then just fill out the service names that you wish to monitor (max 10 names), separated by a comma:

- Then just get the install code and run it on your server as root.
- You can then return to the Installation window at any time to modify which services you wish to monitor (these modifications will require you to re-run the installation code again on your server).
b) Manually editing the HetrixTools Server Agent file:
- Open
/etc/hetrixtools/hetrixtools.cfgwith your favourite text editor. - Find the following text: CheckServices.

- Fill in the services you wish to monitor (part of the service name is also accepted but not recommended) like so:

- Save the agent file with the new changes, and that’s it.
The agent will now send the status of the monitored services to our platform every minute.
Please note: it can take up to two (2) minutes after saving the file for the Agent to send data regarding the monitored services.
After the Services have been defined:
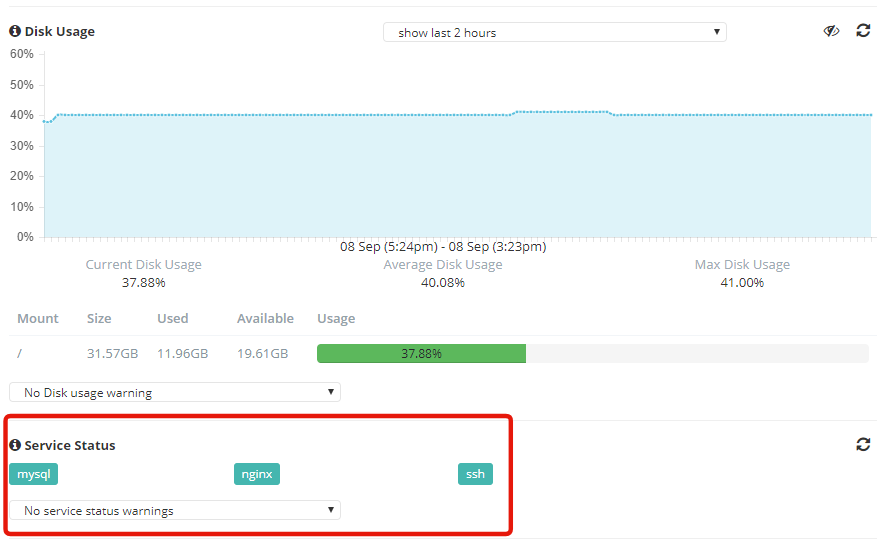
You can see the monitored services along with the other Server Monitoring stats below Disk Usage:

If the service is green, it means its process is running, while if the service is red, it means its process is not running.
You can also choose to be alerted when any of your monitored services ever go down:

But you may not want to be alerted for all of the monitored services. You can simply deselect those:

The unselected services will still be marked as being down (red) in your dashboard if they ever do go down, but you will not receive any alerts for them being down.
You can monitor up to 10 services this way.
