As mentioned in the intro documentation article, the Server Monitor service is part of our Uptime Monitoring product, so before you can deploy your first Server Monitor Agent, you will need to have at least one Uptime Monitor in your HetrixTools account.
Each Uptime Monitor can have one Server Monitor Agent attached to it.
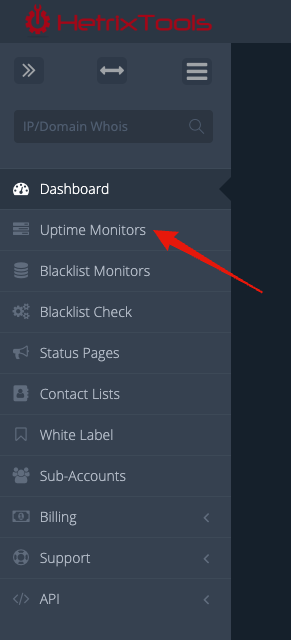
To get started, go to your Uptime Monitors list:
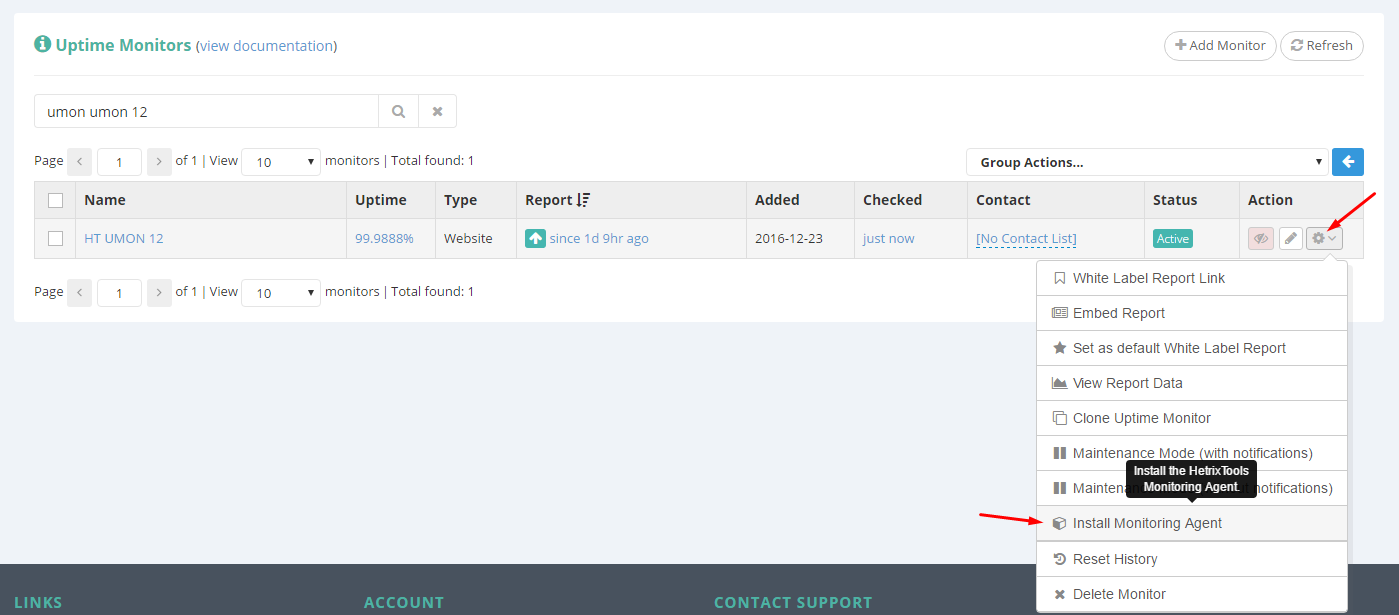
Find the Uptime Monitor that you wish to attach the Agent to, and from its drop-down action menu click ‘Install Monitoring Agent’:
You’ll be presented with a pop-up containing the installation code, which you’ll need to run as ‘root’ on your VPS or dedicated server, that you wish to monitor resources from:
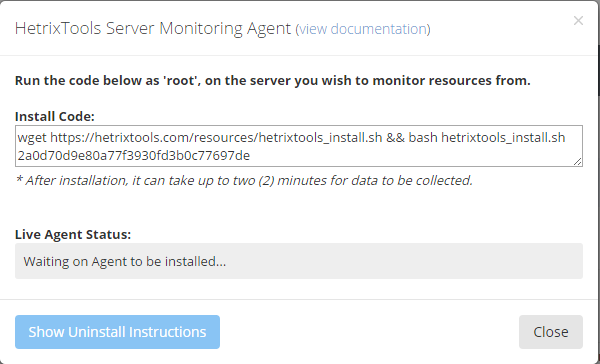
Simply copy/paste that code and run it as ‘root’ on your server in order to install the agent:
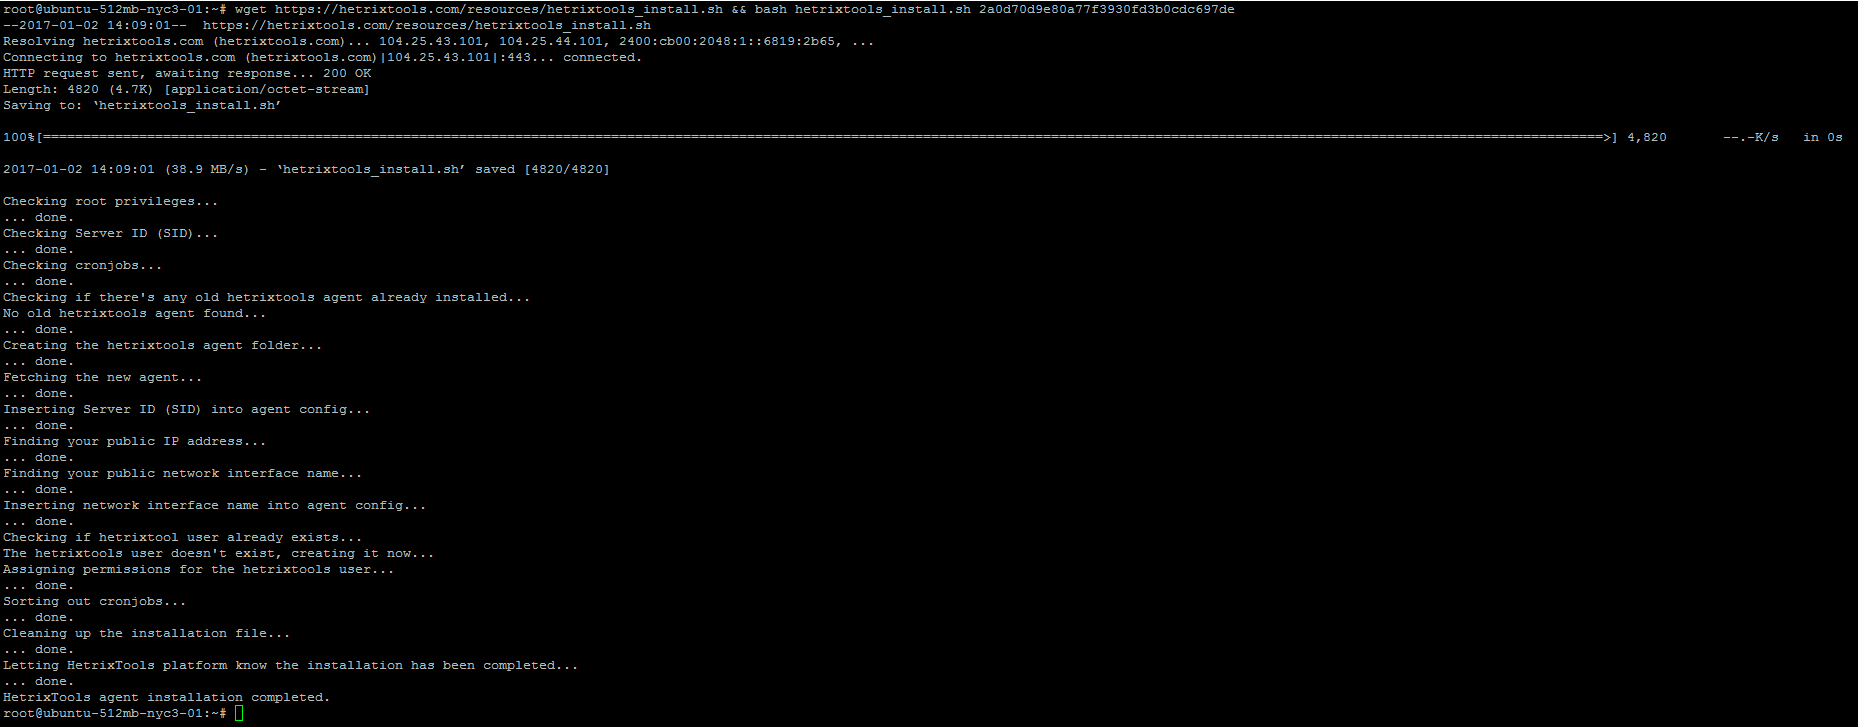
Once you run the installation code, you’ll be able to follow the live status of the installation in the ‘Live Agent Status’ box:
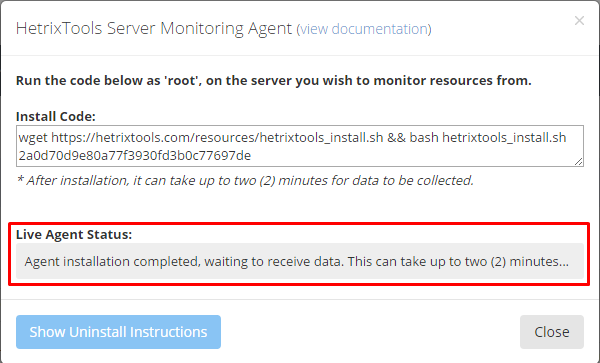
It can take up to two minutes for the initial data to be collected from your server, so your patience is appreciated. You can either leave this pop-up open in order to track the live status of the agent or close it and work on other monitors while the data is being collected from the newly installed agent.
Once the initial data has been received by our platform, you’ll see the following message, which means everything went OK with the agent installation, and data is being received:
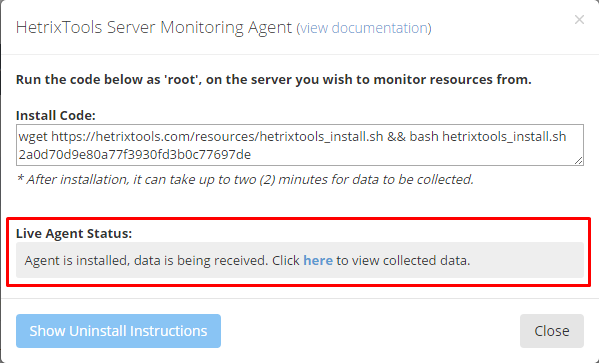
The final status message shown above will also include a direct link opening the resource usage graphs.
Our monitoring agent is a basic shell script, which is open-source and available for anyone to inspect on our GitHub: https://github.com/hetrixtools/agent
If you’re not yet familiar with the shell language, a good place to start learning the basics would be: Introduction to Shell Scripting in Linux