The Location Fail Log contains the exact errors our monitoring locations encountered when trying to access your monitored target.
The entries here are logged at the exact moment when/if any of our locations encounter an issue trying to verify if your monitored target is Online.
The errors in the Location Fail Log can provide all the insight that you need to help you debug the issue which your monitored target was having at the time it failed.
Accessing the Location Fail Log is quite simple, and it can be done from two different places:
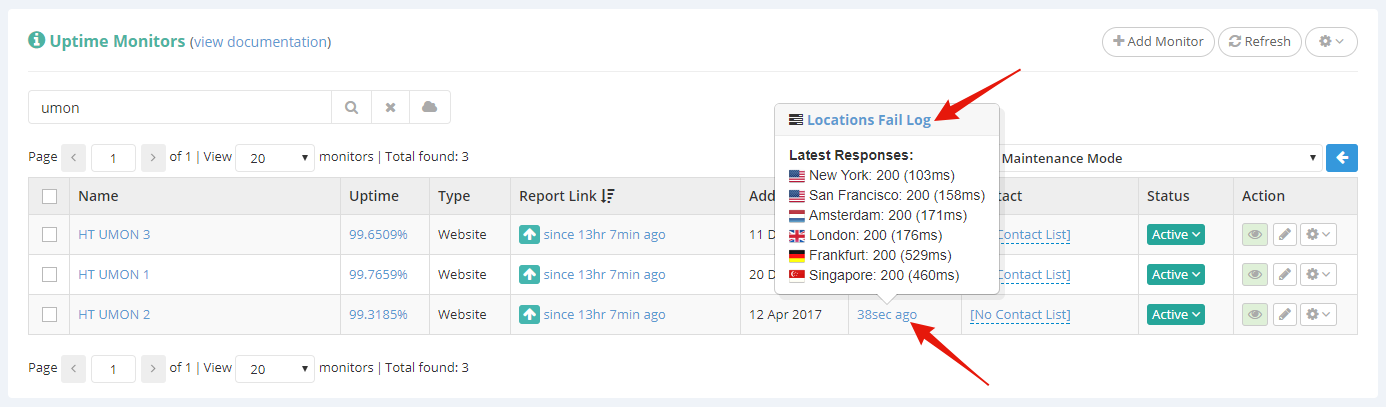
1) from your Uptime Monitors dashboard
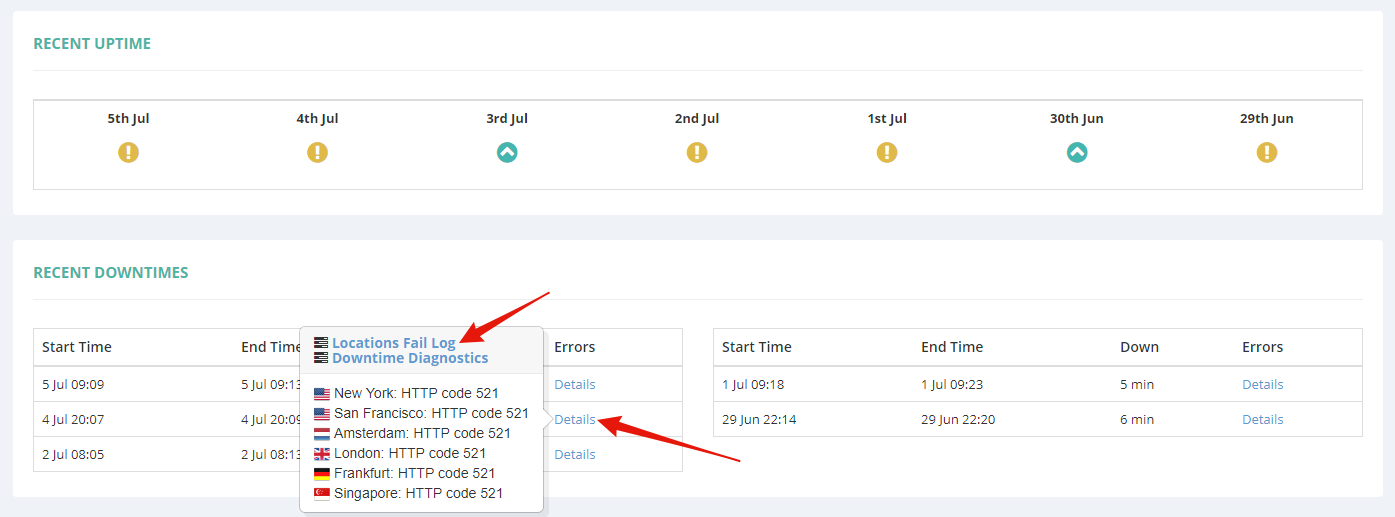
2) from the Uptime Report page of any of your uptime monitor, under the details of any of your detected downtimes
This will open the modal pop-up containing the Location Fail Log for the selected Uptime Monitor, which will look something like this:
When accessing the Location Fail Log from your Uptime Monitors dashboard, the log loads the most recent detected fails ordered chronologically descending, while if you load the log from the Uptime Report page of an Uptime Monitor, the log will automatically load errors chronologically close to the downtime from which you have opened the log from.
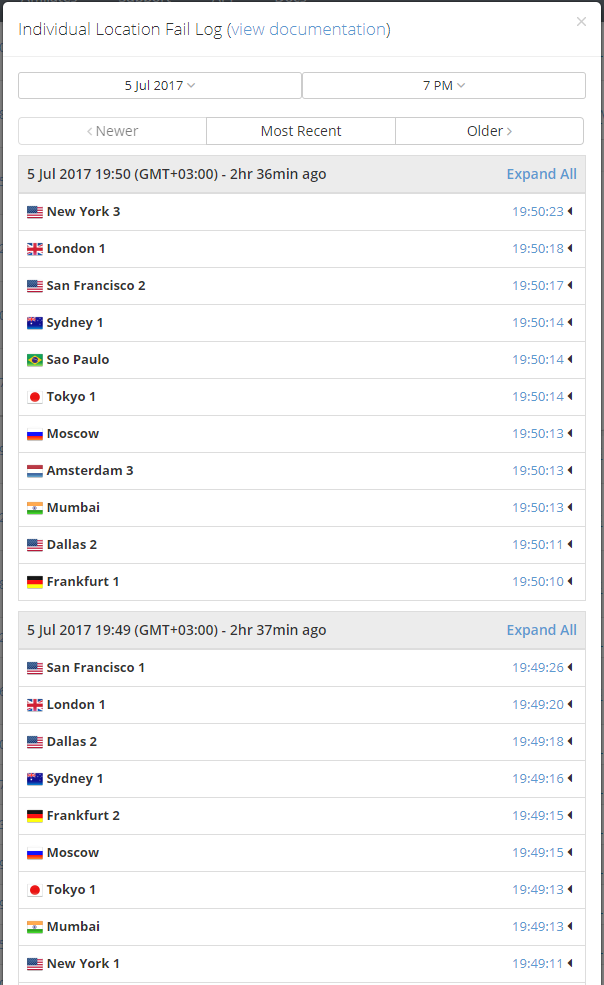
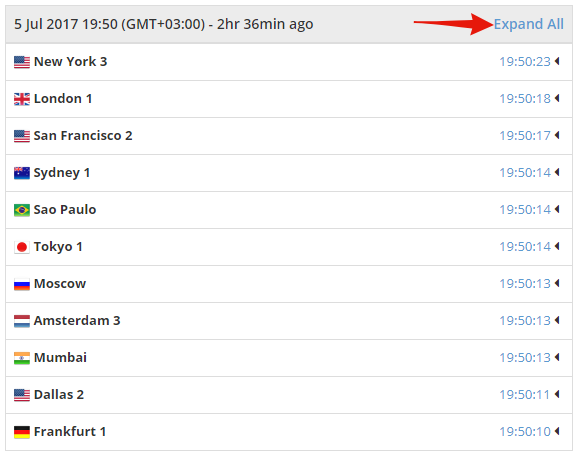
The Location Fail Log will have the entries grouped by minutes, each minute containing all found errors from all monitored locations within the specific minute, ordered chronologically descending.
Clicking on the time stamp of any fail error will open the exact error which was encountered by that specific location at that specific time:
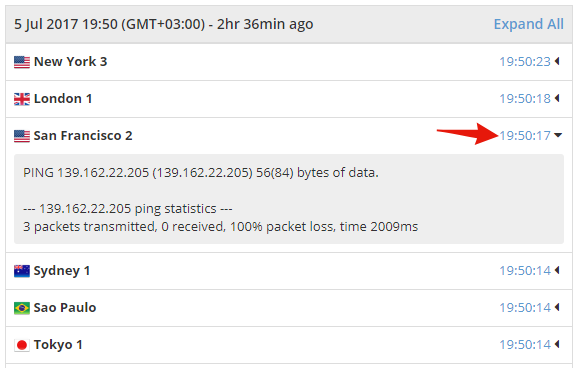
As you can see in the example above, our San Francisco 2 location has had 3 failed pings at 19:50:17 time, towards the monitored location.
You can even expand all of the errors for any specific minute by clicking the “Expand All” link on the top right section of every minute:
This will cause all errors in that specific minute to expand so that you can have a faster overview of that particular minute:
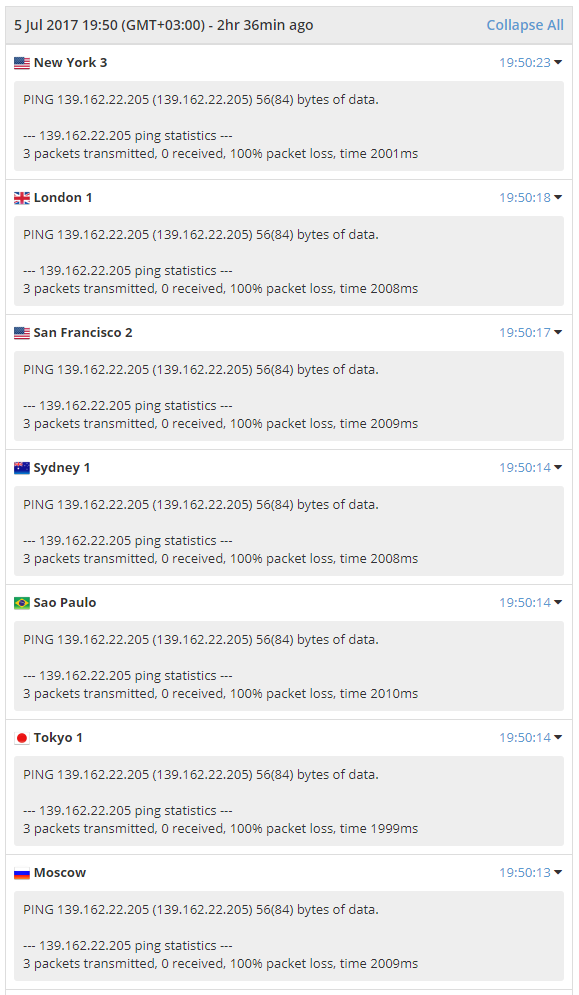
You can also close all of these errors at once by using the “Collapse All” link.
The top navigation of the Location Fail Log is quite simple to use. It has the “Newer / Most Recent / Older” buttons which you can use to navigate around the current time period that you are viewing. And it has two more drop-down buttons, one for the date and the other for the hour, which you can use to go back and forth in time to any specific date/hour, and view the location fails around that time period.
The date and hour drop-down buttons will only contain dates and hours when your uptime monitor suffered any location failure.
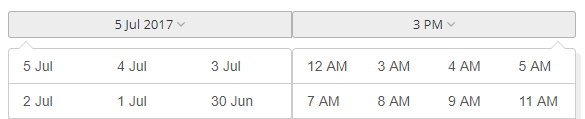
The dates and hours without any location fails will not be shown in these drop-down menus.
Data is collected in the Location Fail Log every 1, 3, 5, or 10 minutes, based on your selected checkup frequency.
However, if your Uptime Monitor is down for more than 24 hours at a time, the Location Fail Log will start storing data less frequently; and if your Uptime Monitor is down for more than 7 consecutive days the Location Fail Log will stop collecting data for that specific monitor. In such cases the data collection will return to normal if/when your monitor comes back online.
You can read about the difference between the Location Fail Log and Network Diagnostics here:
https://docs.hetrixtools.com/difference-between-location-fail-log-and-network-diagnostics/