When detecting an outage, our Uptime Monitoring system will save up Ping and MTR samples from every monitored location towards your monitored target. This way, if the outage was caused due to a network problem, you will have all the info you need in order to debug the issue or properly report it to your upstream provider.
Here’s how to access your Network Diagnostics.
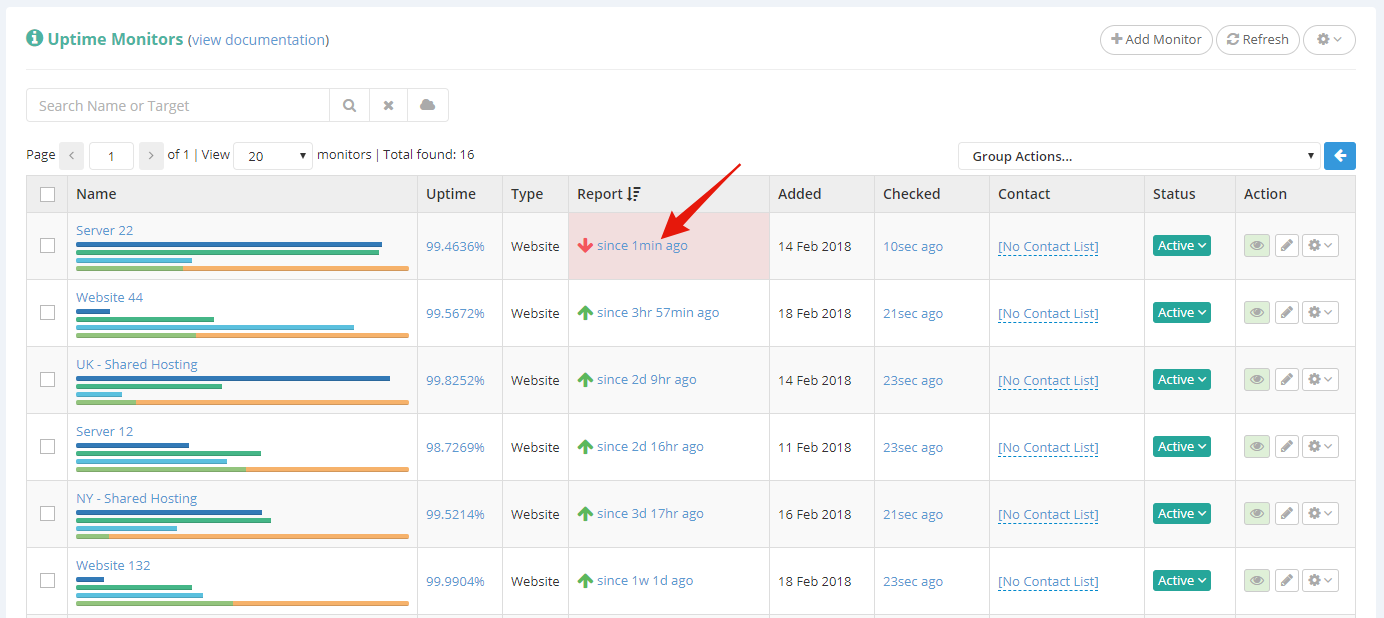
Start by going to your Uptime Monitors page, from the top side menu on your dashboard, and access the uptime report that you wish to view.
On the uptime report page, scroll down to the “Downtimes” section, and click “Details” next to the downtime you wish to inspect.
Please note that if your uptime monitor had no downtimes, the “Downtimes” section will not be visible.
If any Network Diagnostics have been recorded for the selected downtime, you will notice the “Network Diagnostics” link at the top of the popover.
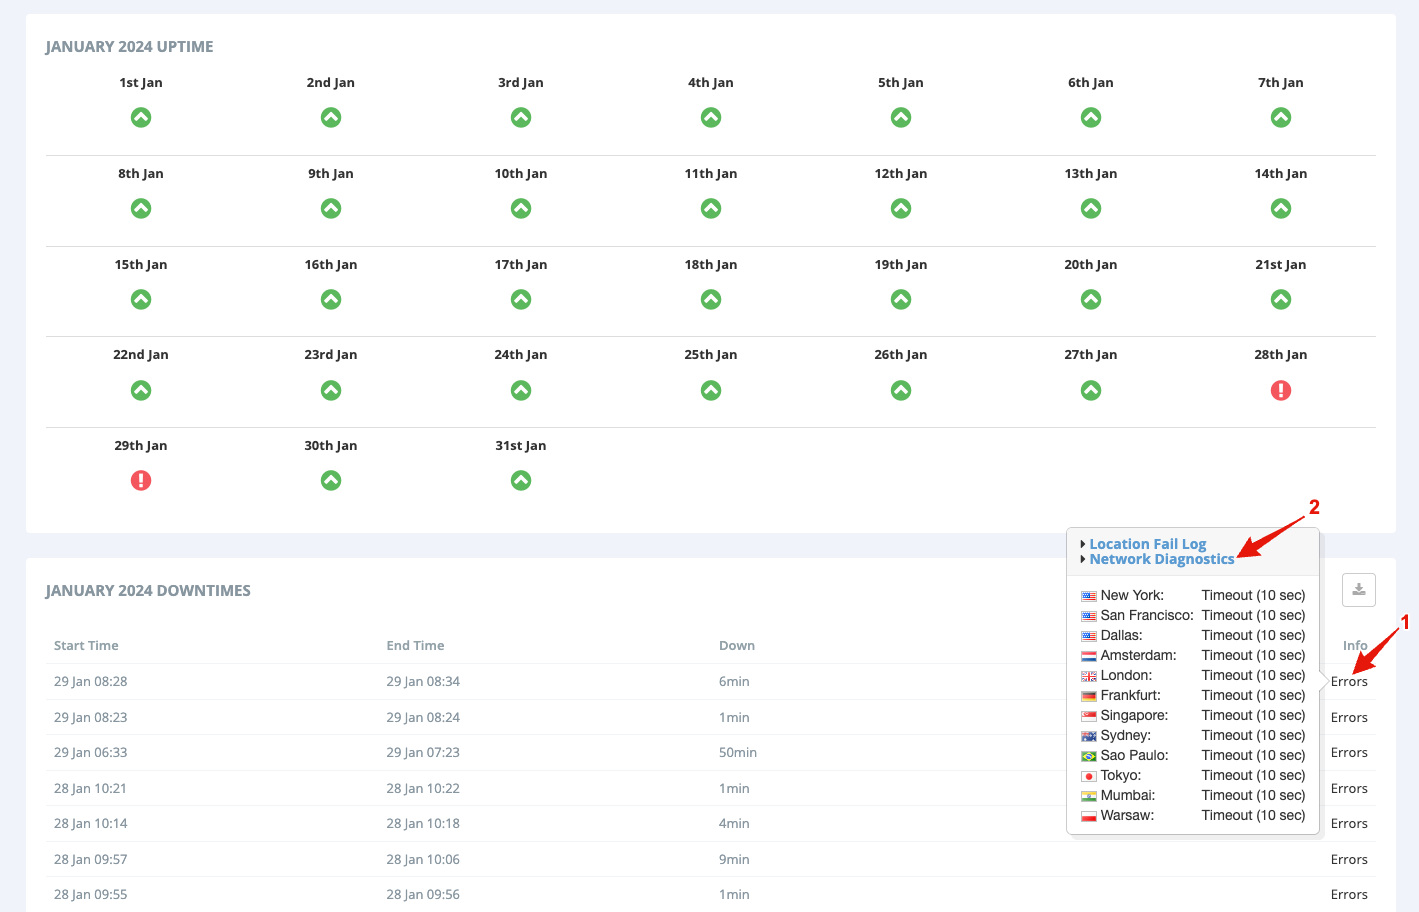
Clicking the “Network Diagnostics” link will bring up the diagnostics collected for this specific downtime.
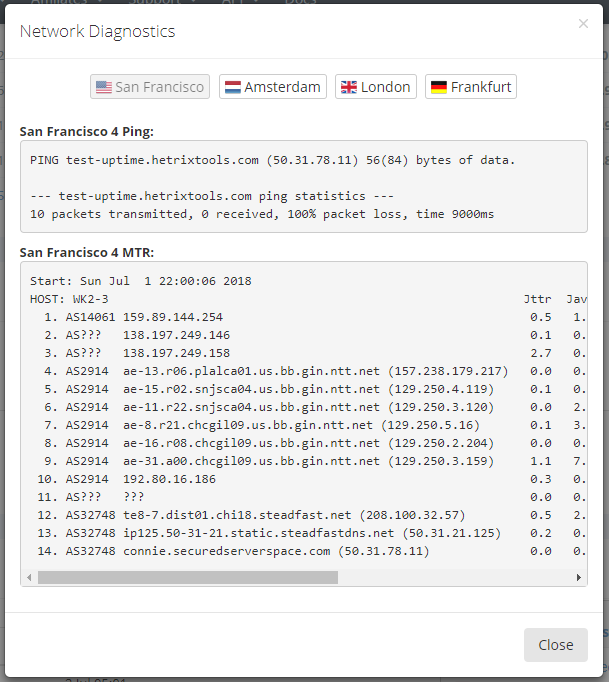
These diagnostics should help you resolve the issue if it’s still occurring, or help you debug what has happened if the issue has already been fixed by a third party.
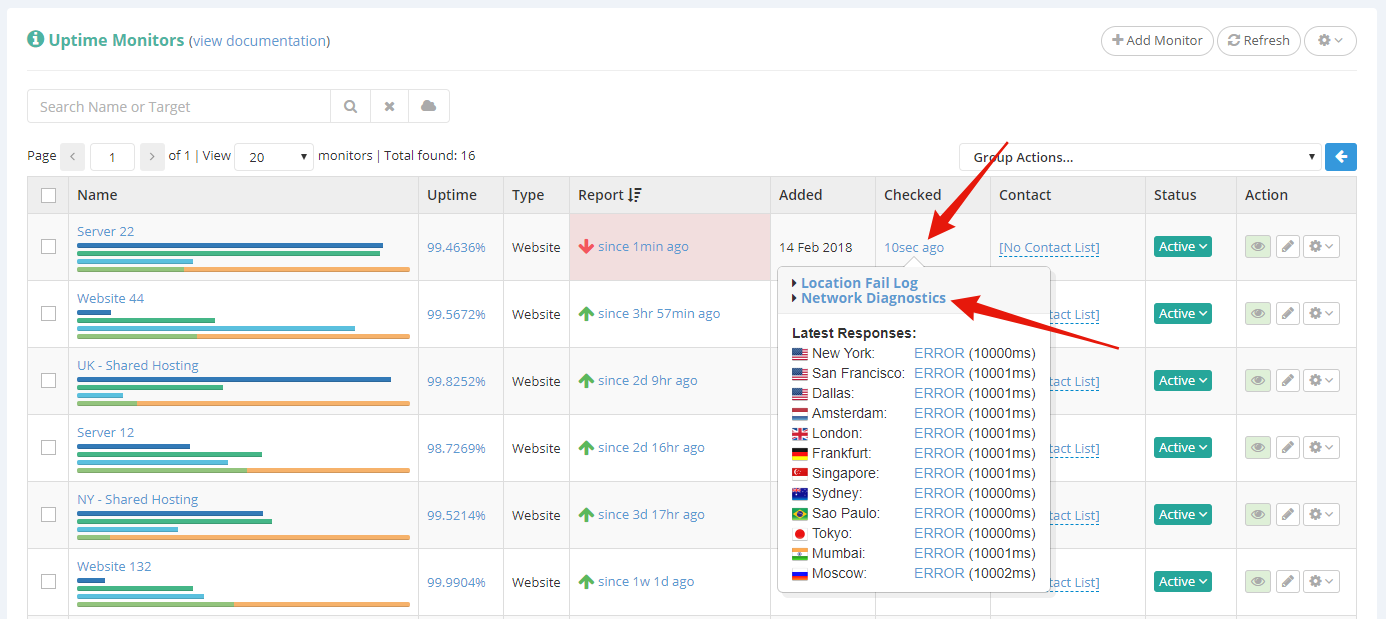
You can also access the Network Diagnostics from your Uptime Monitors list, but only for the current outage and only if this outage is in progress.
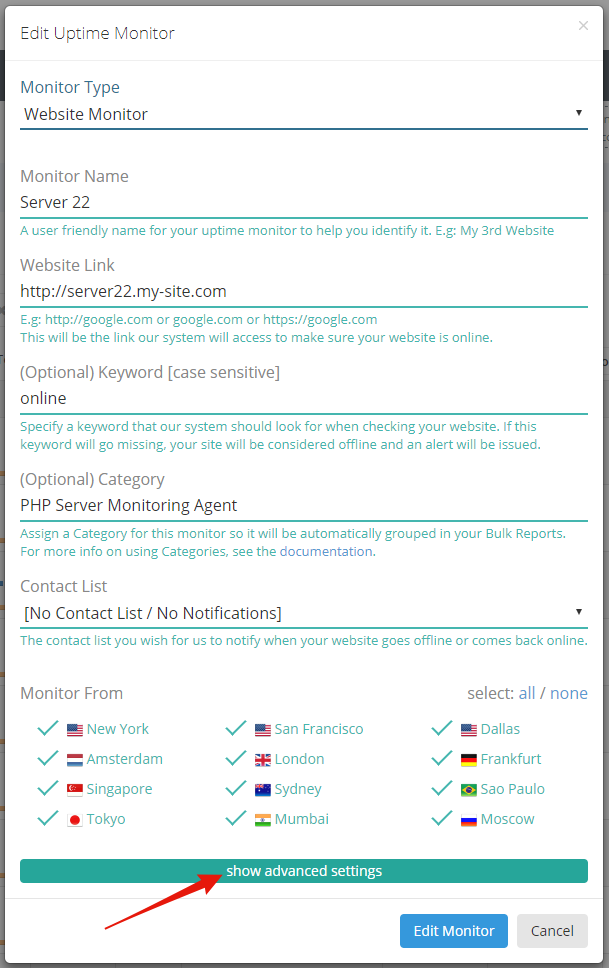
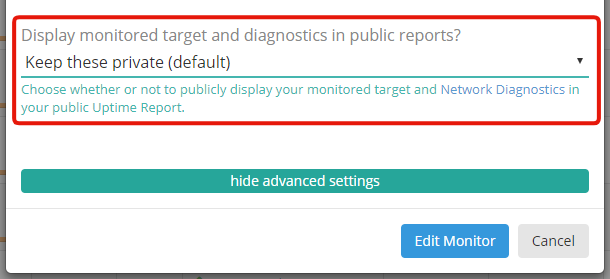
By default, the Network Diagnostics are private, and can be seen only by the report owner while being logged in. You can make the Network Diagnostics publicly available in your public uptime reports, by going to your Uptime Monitor “Advanced Settings”, and changing the option.

Please note:
- The ping and MTR are collected from each monitored location at the time the downtime is noticed by our system.
- If your website is behind a service such as CloudFlare, then the ping and MTR will hit the CloudFlare IP address, not your server’s IP address, rendering these diagnostics useless. In such cases, we advise you to monitor your server’s IP directly if you wish to have properly working Network Diagnostics.
- The Network Diagnostics will not indicate anything wrong if the outage was caused by a non-network issue (i.e., crashed web server, high CPU usage, laggy scripts, etc.).