Starting with version 1.05 of the HetrixTools Server Monitoring Agent, we’ve introduced multiple disks support.
You will be able to find all of your mount points under the “Disk Usage” section of your Server Monitoring stats in your dashboard:

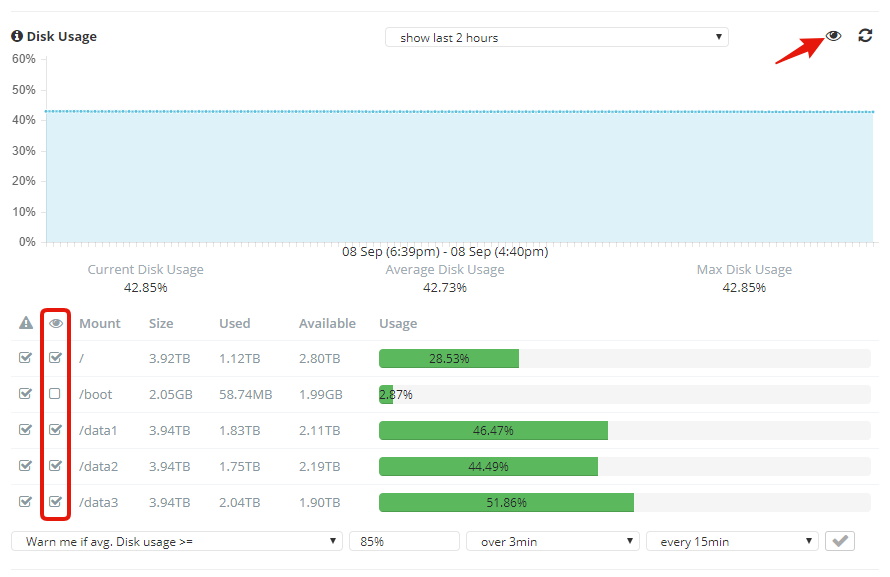
For an easy “at a glance” view of your entire server disk space, each mount point has its own size and usage stats next to it.
The “Disk Usage” graph will contain all of the server’s disk space summed up.
There is no history of the individual disks usage.
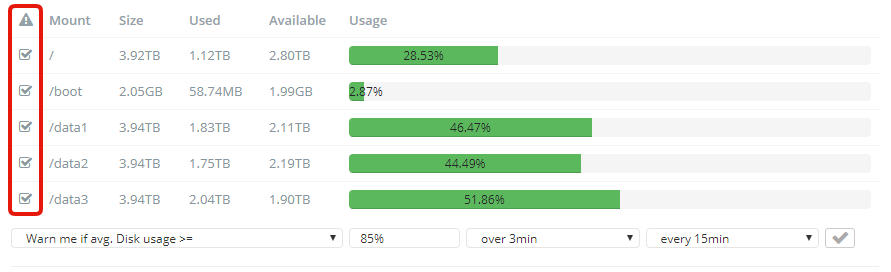
Setting disk usage warnings also supports multiple disks. When enabling disk usage alerts now, you will see a selectable column appear next to the disks table. You can select the disks you wish to be alerted for when exceeding your set warning limit:
The Privacy setting works the exact same way as the warning setting. When “Disk Usage” is set to public, a Privacy column will appear next to the disks table. You can select the disks you wish to appear in your uptime report under the “Disk Usage” section:
The selected disks will appear in your Uptime Report, like so:

Furthermore, each individual Disk Usage bar will be green until 80%, after which it turns orange till 90%, and then turns red in order to signal the danger of running out of storage space.