Once you’ve installed our Server Monitoring Agent on one of your VPS or dedicated servers, you’ll be able to access the resource usage data from your Uptime Monitors list:
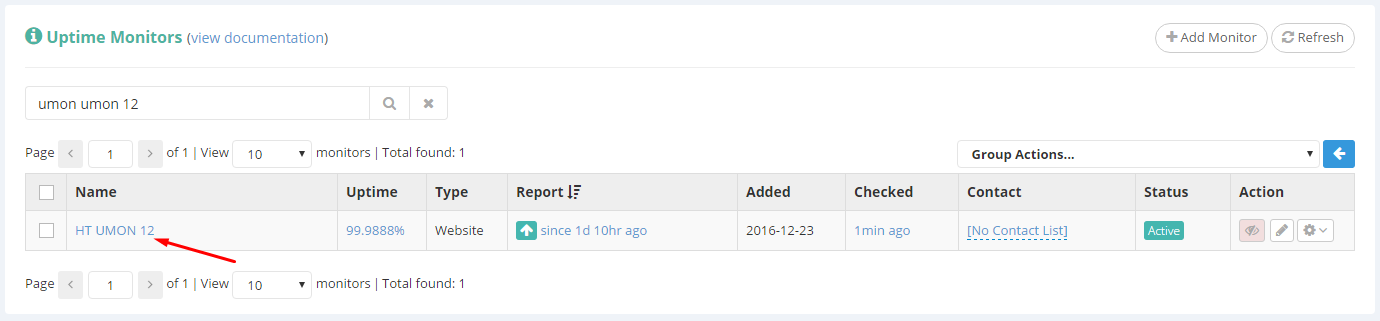
Simply click the Uptime Monitor name that you’ve installed the agent on:
A pop-up will open, containing all of the graphs from the collected data:

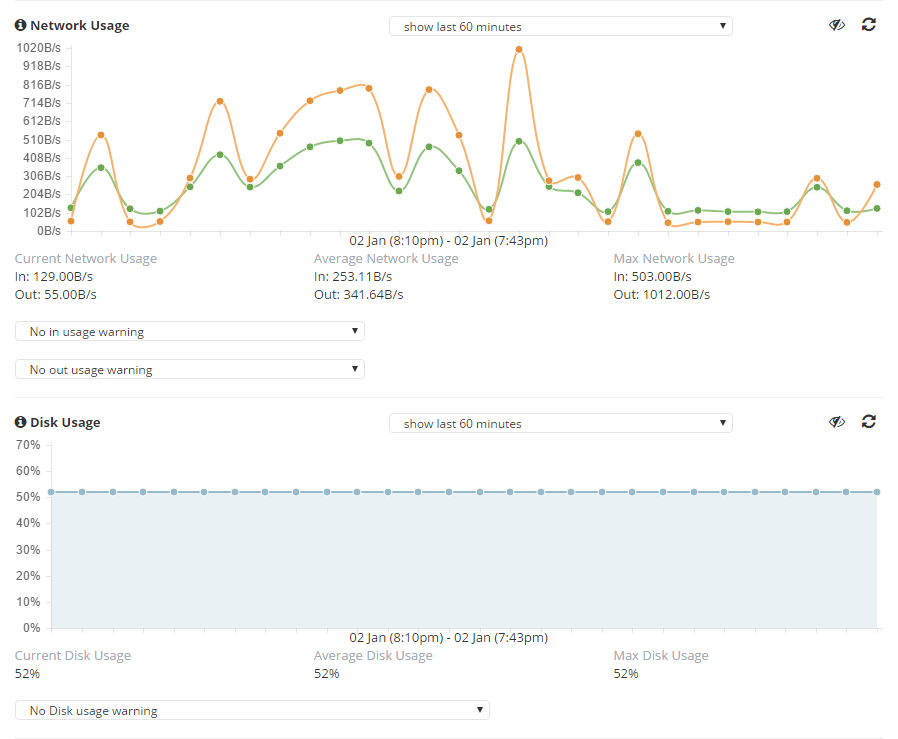
You can easily select to view the last X hours/days, or even a specific date, from the time navigation above each graph.


Everything is responsive, and won’t require further page loads to display new data as you browse through the dates.
Pingback: Set Resource Usage Warnings – HetrixTools