Being alerted whenever your server starts using up too many resources is sometimes critical for your business and infrastructure. Using our Server Monitoring Agent you can easily set up warnings, directly from your dashboard.
Start by opening up the collected data from any of your Uptime Monitors that have a Server Agent attached to them:
https://docs.hetrixtools.com/accessing-server-monitoring-data/
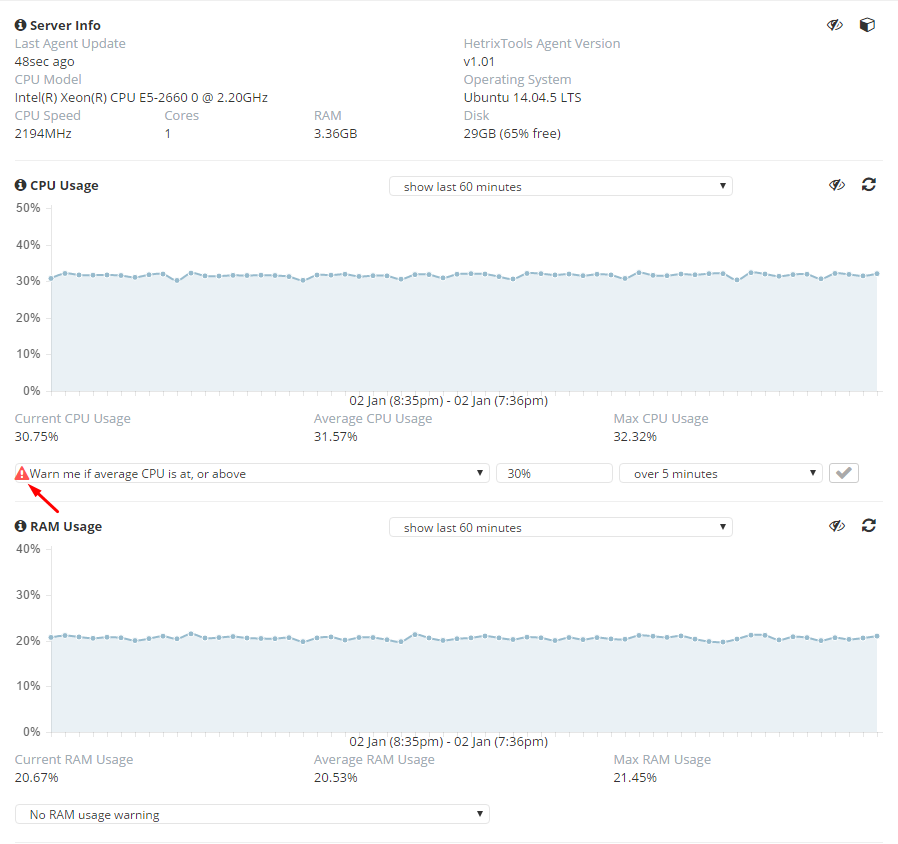
In the example below we’ll set-up a CPU Usage warning:


The CPU Usage warning in the example above is set to send out warnings every 10 minutes if the usage is at, or over 40% average over a period of 5 minutes.
Please note that alerts are being sent out to the contact list attached to the Uptime Monitor. If there is no contact list for that specific monitor, then no alert is being sent out, even if configured as shown above.
Once the usage is at, or goes above the defined percentage, our system will start sending out alerts, until any of the following happens:
– the average load over the selected period drops below the warning defined limit; OR
– the Uptime Monitor is put under maintenance with no notifications; OR
– the usage warning limit is increased or removed from the monitor.
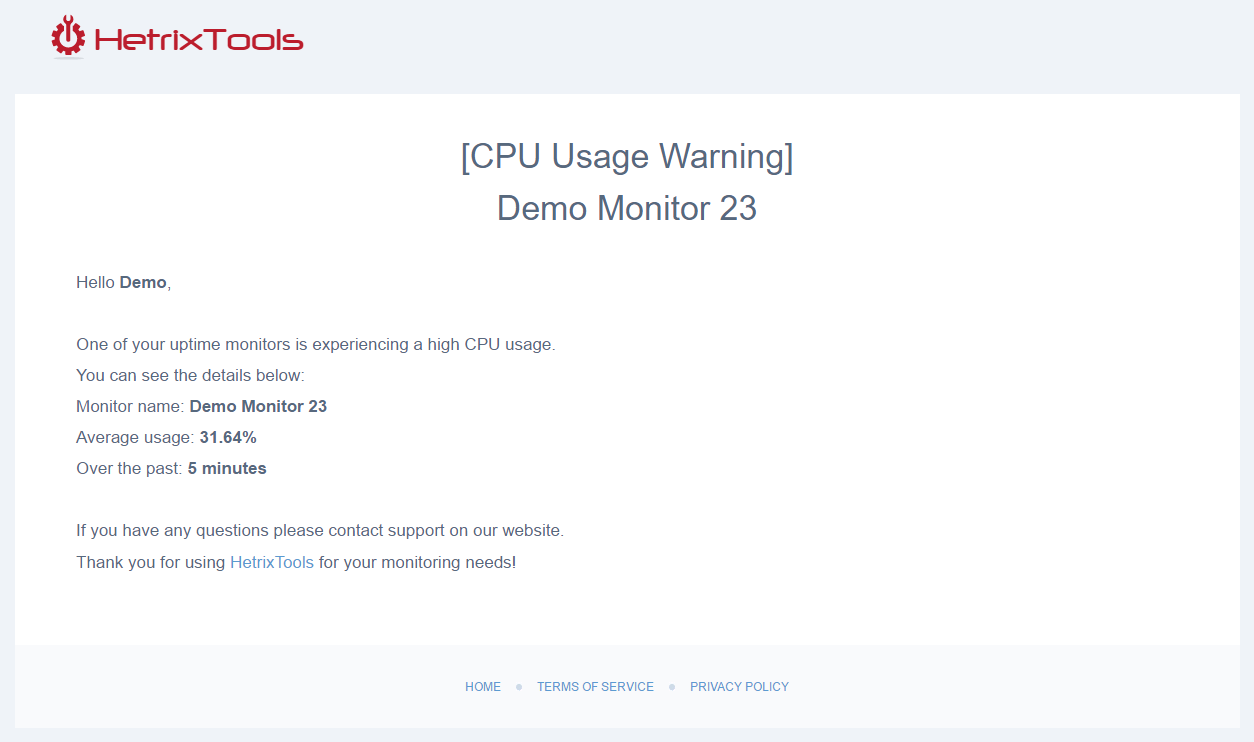
The alert will contain information about which Uptime Monitor is affected, and the current average usage that triggered off the alert:
In addition to alerts being sent to the Uptime Monitor contact list, you will also have visual warnings in your Uptime Monitors list, for the monitors that are at, or over the warning limits:

Clicking the warning sign or the monitor’s name will open (as usually) the resource usage data, where you’ll also have visual indicators to help you quickly find which resource is over the warning limit:
Following the exact same information, as described above, you can set the following warnings:
- CPU usage warning
- RAM usage warning
- Network inbound usage warning
- Network outbound usage warning
- Disk usage warning