Starting off with version 1.5.4 of our SSH Server Monitoring Agent, you can now view the running processes in your HetrixTools Server Monitoring Dashboard.
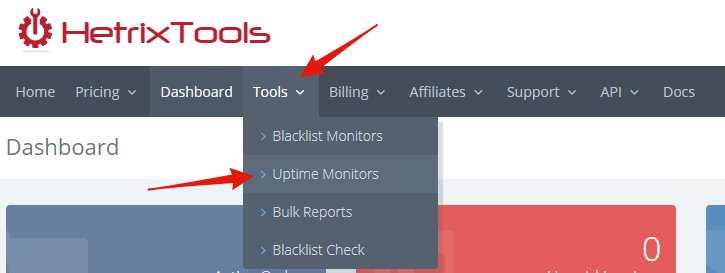
Here’s how to access this info. Begin by going to your Uptime Monitors page in your dashboard:
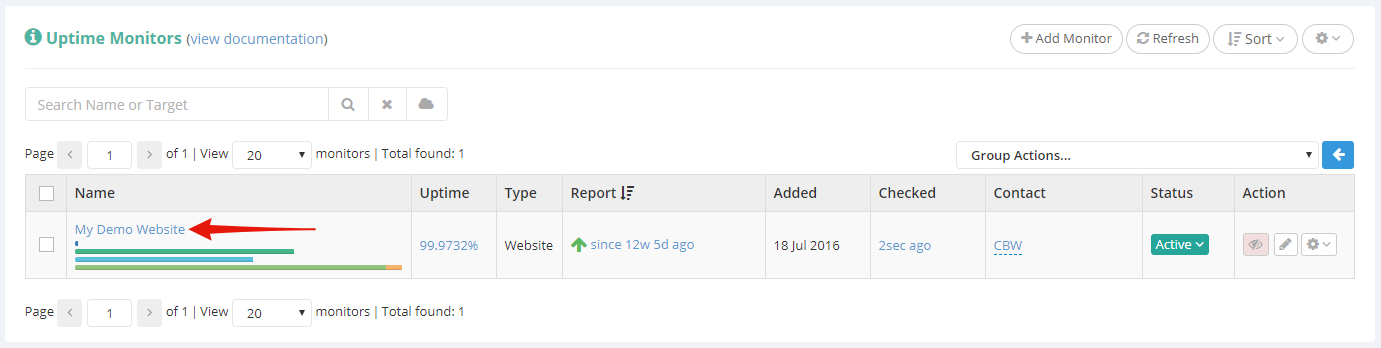
Click on the Uptime Monitor name that you wish to view the Server Monitoring stats for:
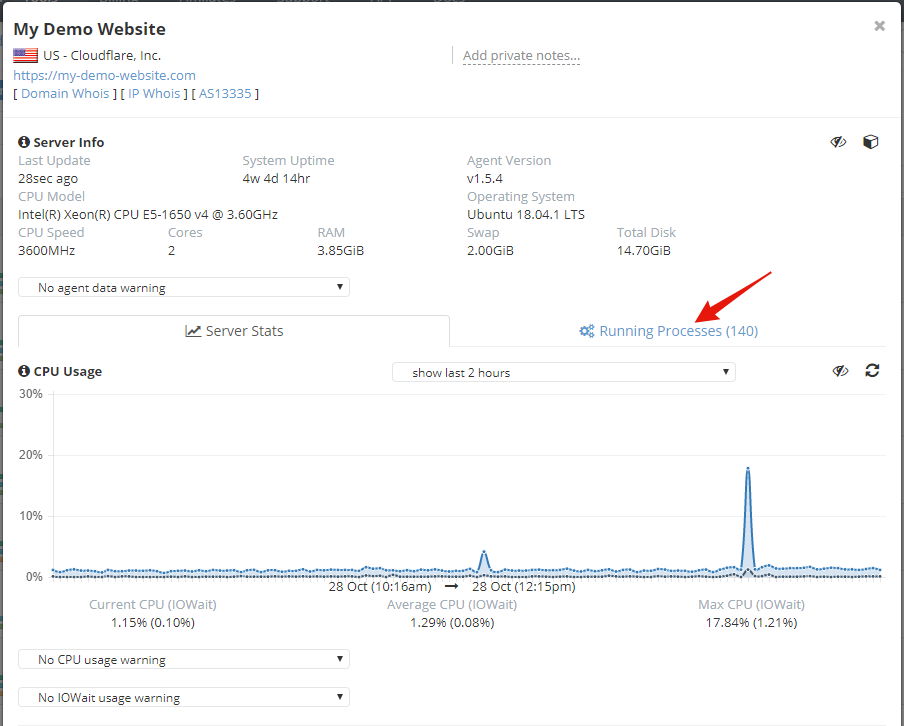
Once the stats modal opens up, locate the “Running Processes” tab, and click it:
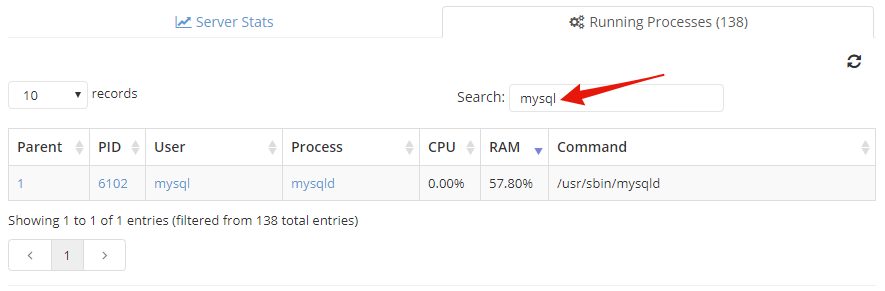
In here, you’ll be able to see all the processes currently running on your server, along with their CPU/RAM usage, owning user, parent id, process name, and command.
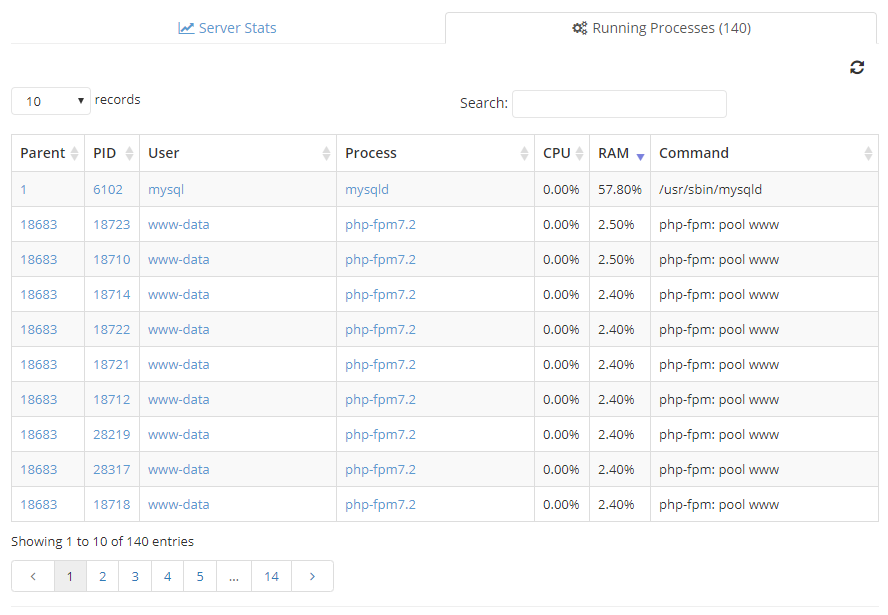
You can order all of these processes, ascending or descending, by simply clicking on the table headers.
You can also search through your processes by name, command, or user:
Furthermore, you can also click on a process name, user name, process id or parent id, and you will be shown only the processes that fall in that category, along with a 2 hours graphic showing the CPU/RAM usage of this particular category of processes:
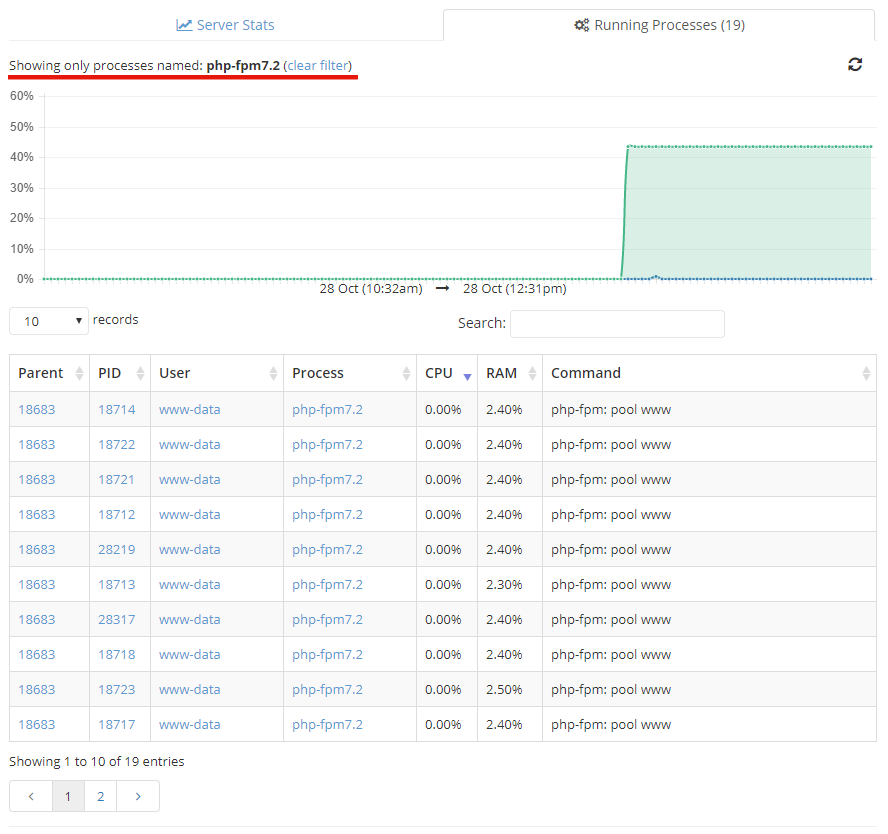
This would allow you to view the recent usage history for any particular process, or any processes owned by a certain user, etc.
This feature keeps track only of the currently running processes, saving up CPU/RAM usage history of up to 2 hours for each process.