The Uptime Monitors that have a Server Monitor agent attached to them will display some quick ‘at a glance’ info about the current server resource usage, under the monitor’s name.
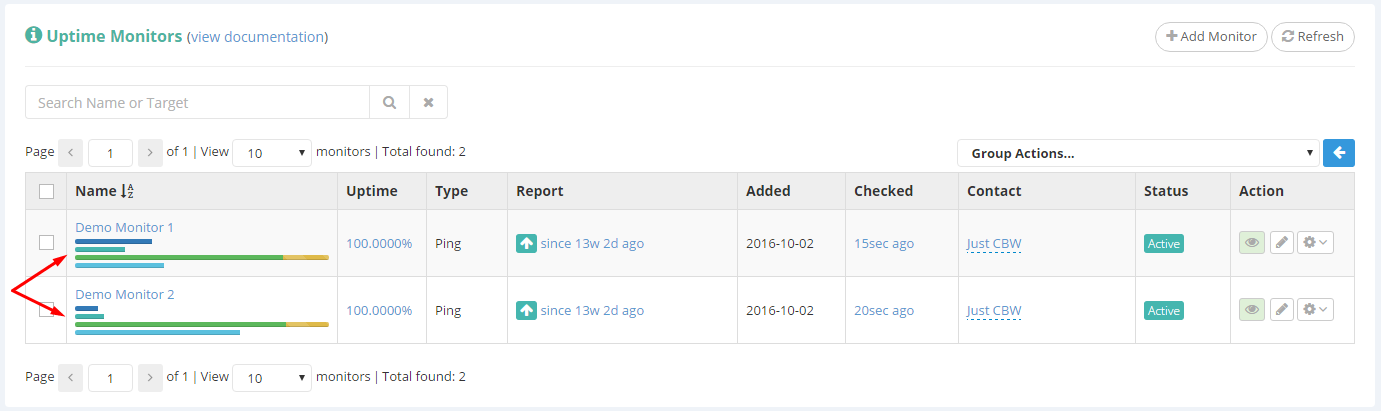
The 4 bars will indicate the current CPU Usage, RAM Usage, Network In/Out Usage, and Disk Usage.
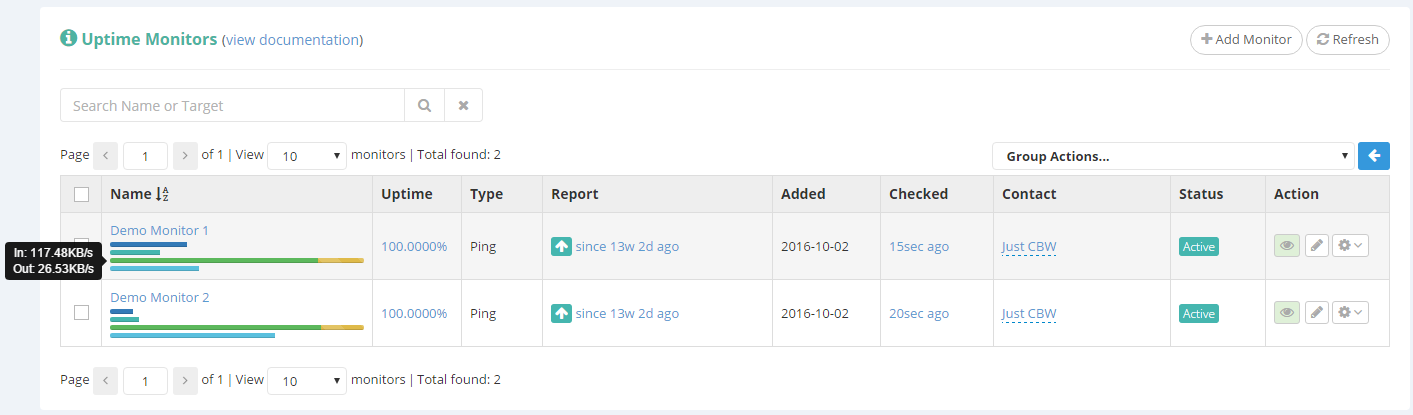
Hovering over any of the bars will show the exact usage numbers.
Of course you can click the monitor’s name to open the full panel, containing the resource usage graphs.
Having the current usage displayed at a glance will help save you time, not having to open each panel individually just to have an overview of multiple monitors.