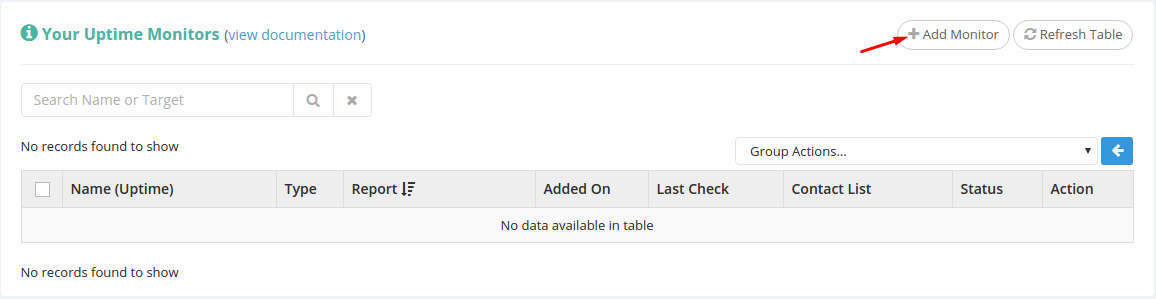
Let’s start by clicking the “Add Monitor” button on the Uptime Monitors page.
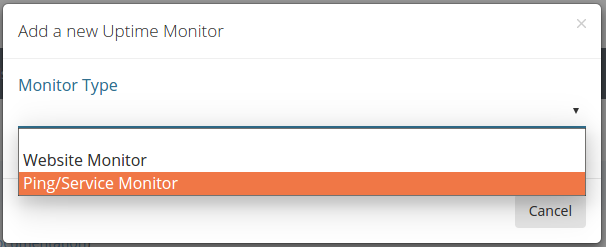
You’ll notice a pop-up window appears. Select “Ping/Service” from the select list.
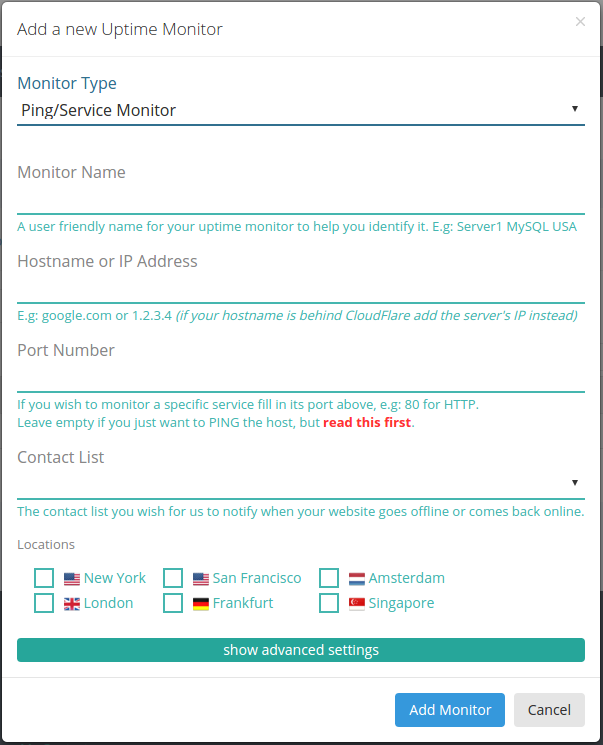
Now the window just expanded to contain more fields, which we’ll go through below.
Standard Settings:
- Monitor Name – this should be a user friendly name for your service uptime monitor, that will be shown in your uptime reports and will be used to quickly identify your uptime monitor.
- Hostname or IP Address – in here you’ll need to input the hostname or ip address of the service you wish to monitor. It’s worth mentioning that if your service is behind a provider such as CloudFlare, you should input the server’s IP and not the protected hostname.
- Port Number – will be the port on which the service runs, i.e., for FTP put 21, for HTTP put 80, for HTTPS put 443, etc. You can leave this empty if you just want to ping the host, but if you do, then be sure to read this article first: https://docs.hetrixtools.com/avoid-ping-false-positives/
- Contact List – you can either use one of your existing contact lists or select [No Contact List / No Notifications] if you don’t wish to be notified when an outage occurs.
- Locations – here you can select where you want your service to be monitored from.
Advanced Settings:
- Timeout – if your service does not respond after this many seconds, it will be considered offline.
- Checkup Frequency – here you can set how often our system should check your service uptime.
- Number of Failed Tries – our system will retry this many times before considering your service offline.
- Number Of Failed Locations – this many locations have to consider your website offline before issuing an alert.
Once you’re done configuring the field, you can click the “Add Monitor” button at the bottom of the window.
The service monitor will be added to your Uptime Monitors list and will await its initial checkup.
You can always use the “Refresh Table” button to see any changes in your Uptime Monitors list.
Your service uptime monitor has now been checked, and it’s ready to show you the needed information.
Pingback: How to create a beautiful Uptime Status page – HetrixTools