
Our platform will perform the following actions in your configured workspace:
- For Uptime Monitor outages:
- Open a new task when an uptime monitor goes down.
- Post follow-ups in the same task if Repeated Alerts are configured for each subsequent notification related to the same outage.
- Close the task when the uptime monitor comes back online.
- For Uptime Monitor other notifications:
- Open a new task for other related notifications, such as SSL Expiration, Domain Expiration, Nameservers Change Detection, etc.
- For Server Metrics Monitor:
- Open a new task for any configured Resource Usage Warnings.
- Post follow-ups in the same task for repeated resource usage warnings related to the same incident.
- Close the task when the resource usage goes back below the warning threshold.
- For Blacklist Monitors
- Open a new task whenever blacklisting or delisting is detected.
This guide will show you how to configure our Jira integration so that you and your team can receive our notifications as tasks opened in your Jira workspace.
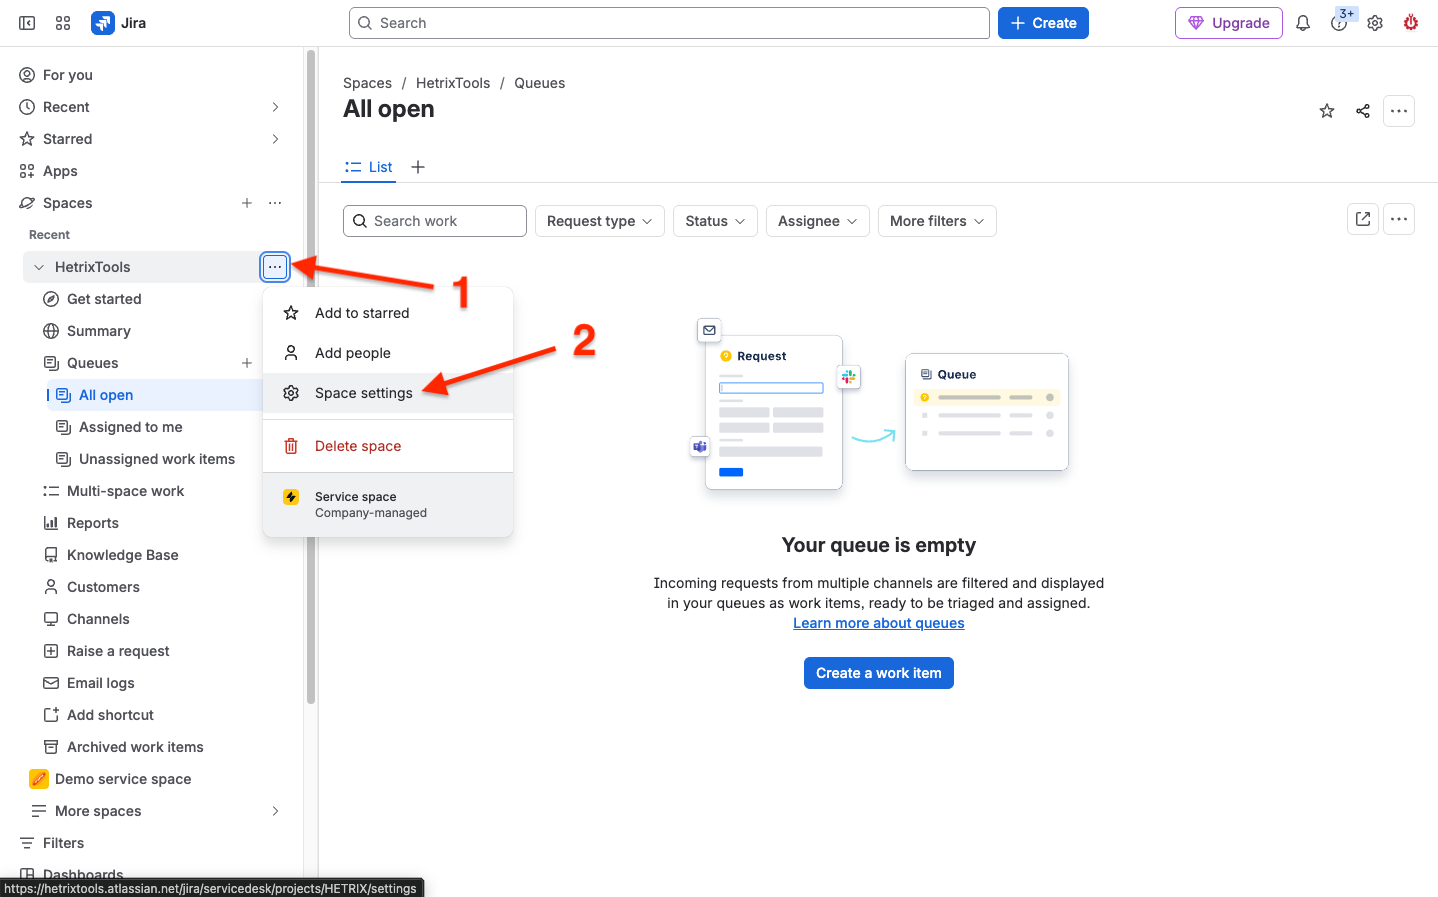
Start by opening your Jira workspace and accessing “Space settings” for the workspace you wish to configure our integration for.
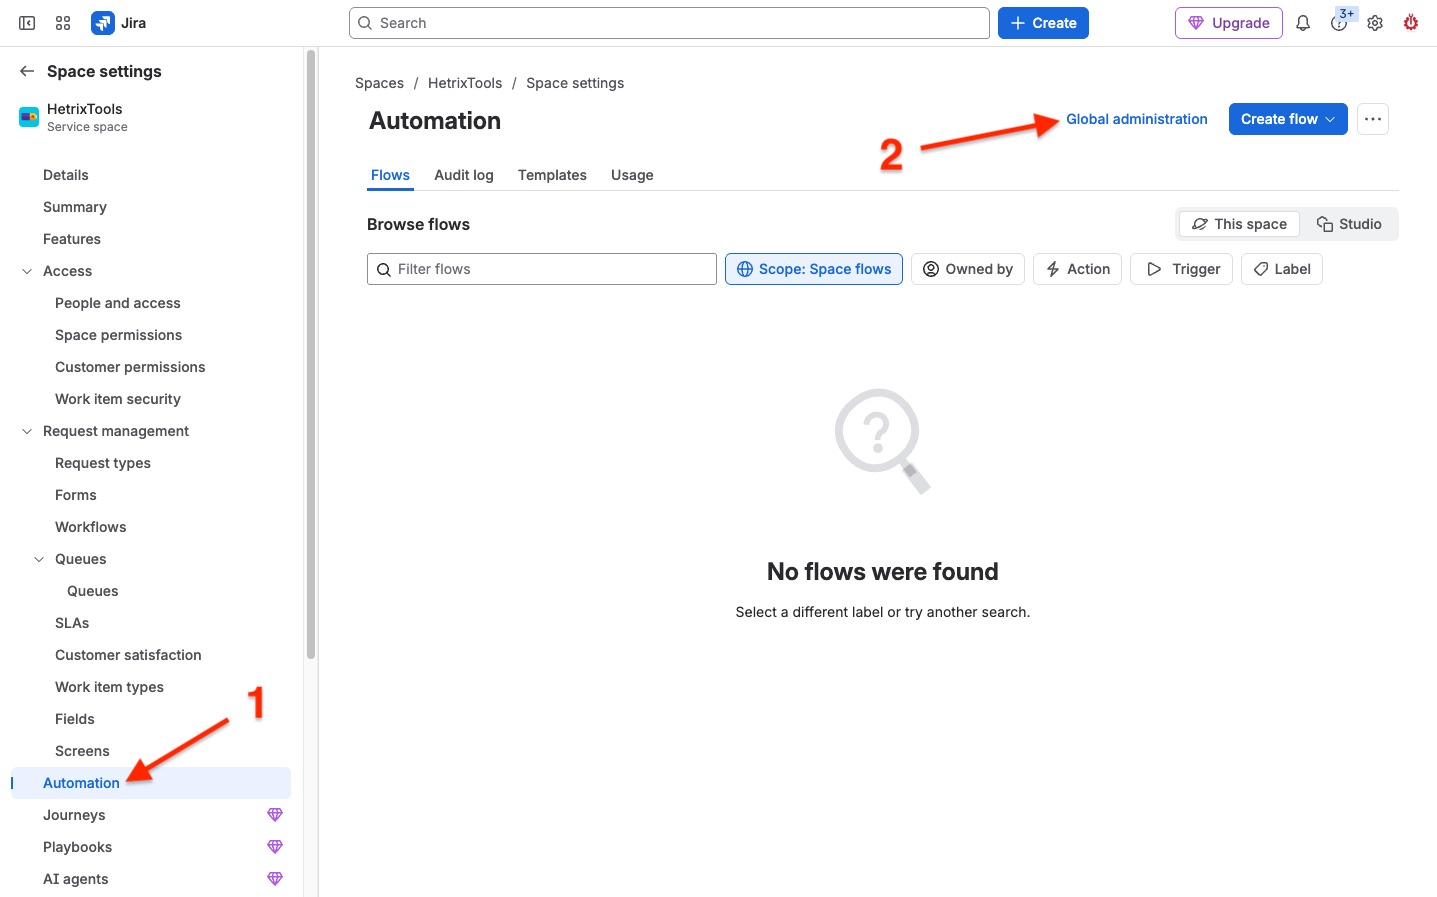
On the “Space settings” page, locate and click on “Automation” from the left-side menu. Once that page loads, locate and click on the “Global administration” link as shown below.
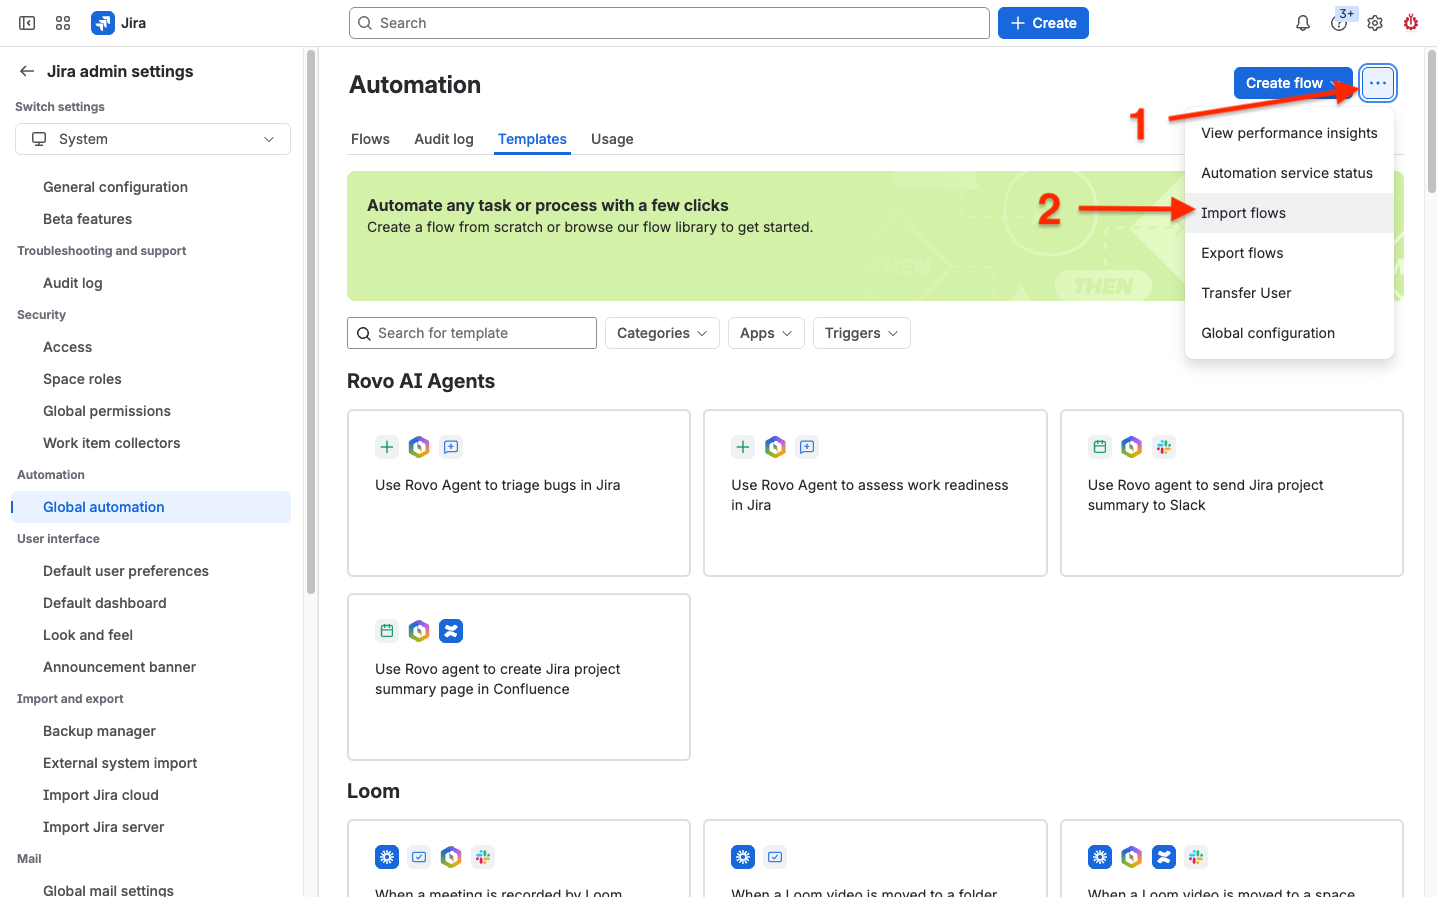
On the “Global automation” page, click on the drop-down actions menu located towards the top-right of the page, and then click on “Import flows”.
Download our preconfigured Jira Flow template from here:
https://hetrix-assets.b-cdn.net/jira/flow-v1-2026-09/jira_flow_template.json
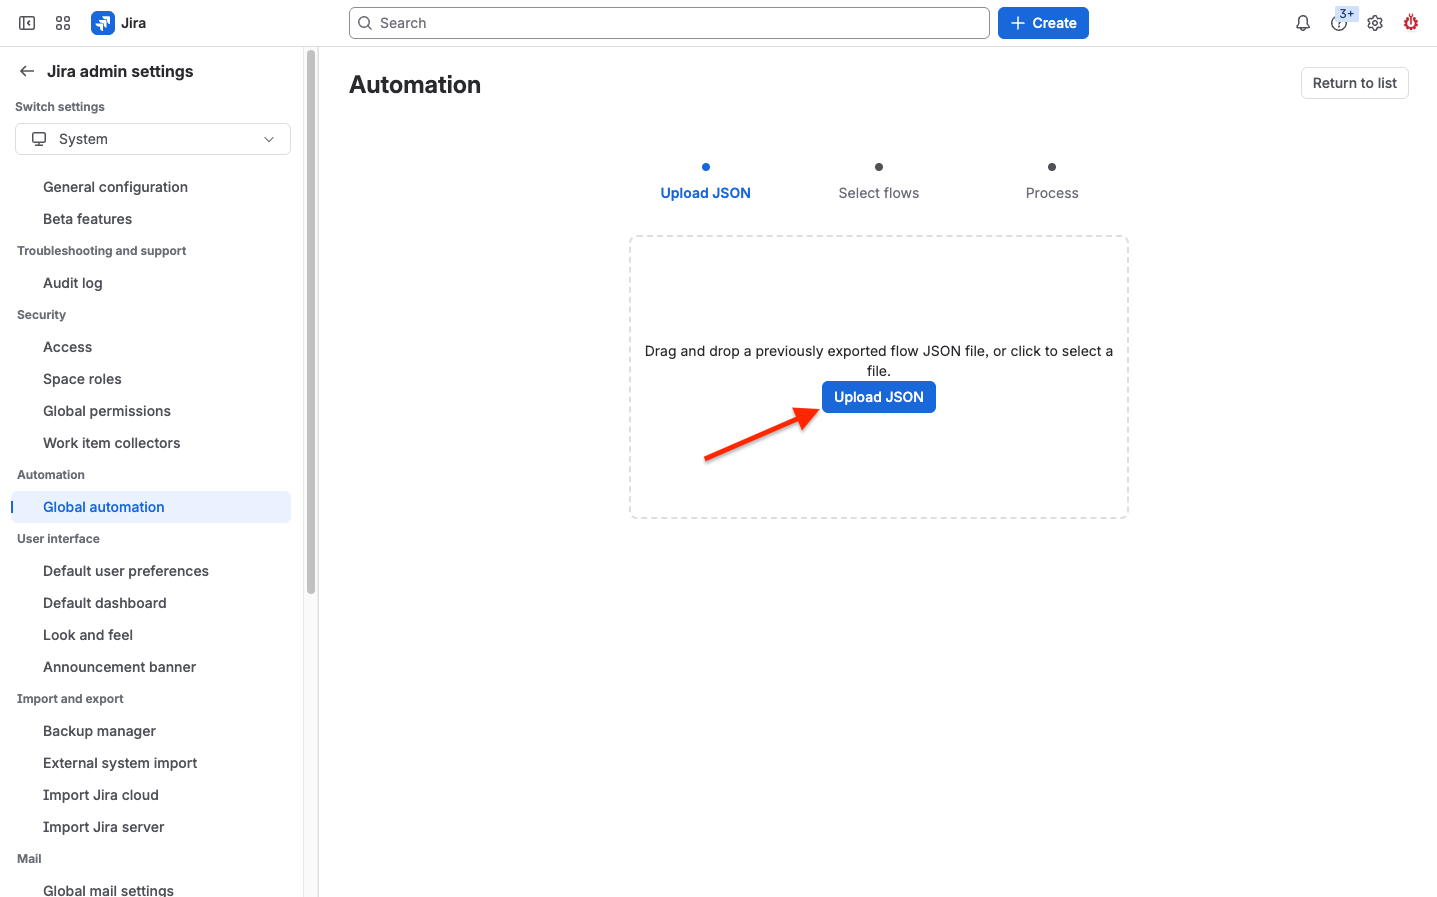
On the “Import flows” page, upload our Jira Flow template downloaded from the link above.
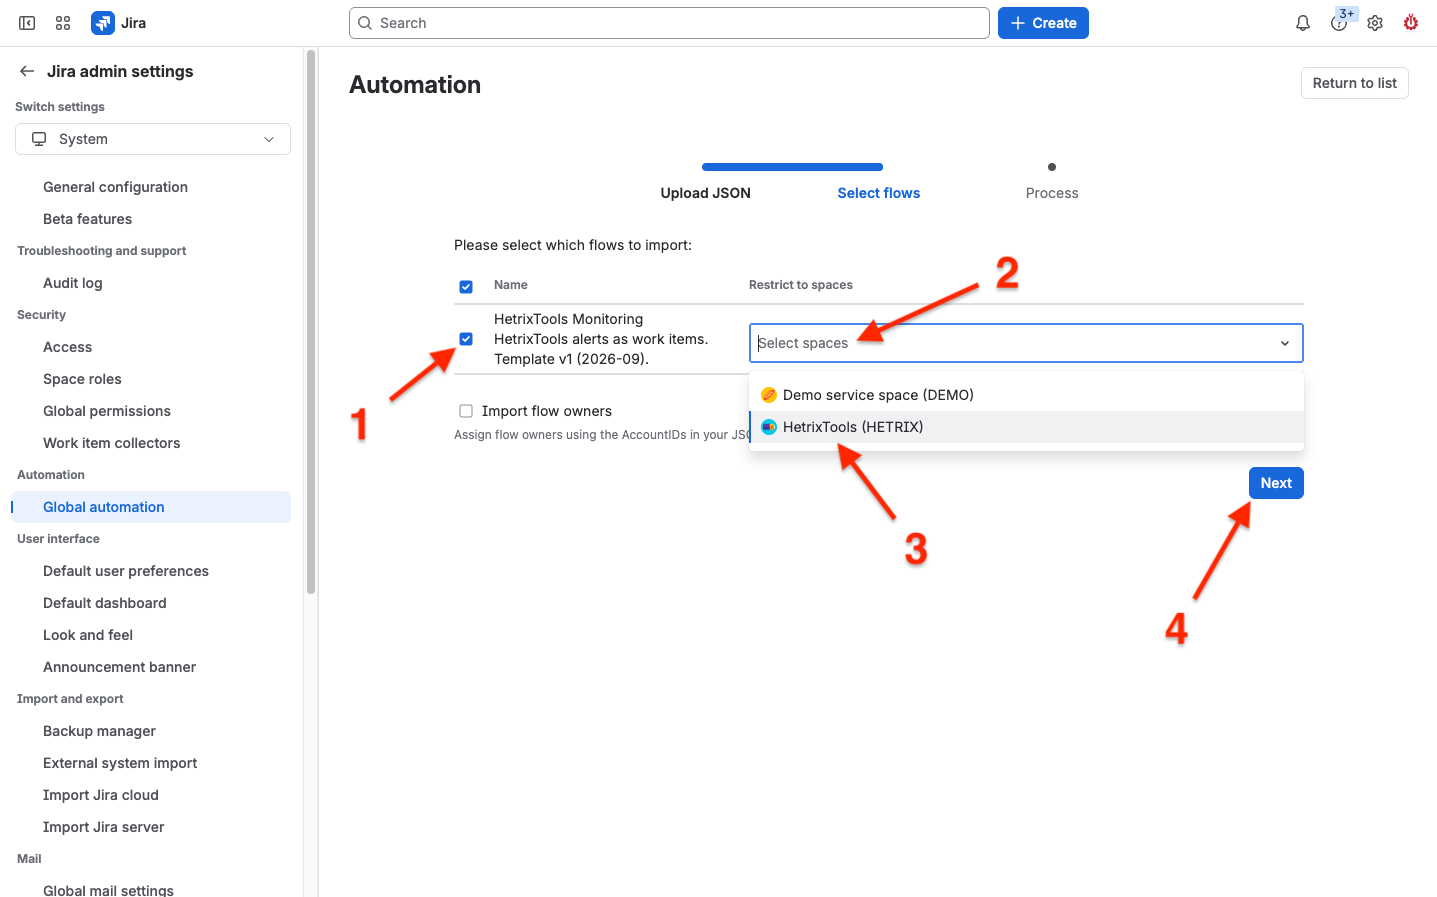
Once our template is processed and validated, you will be taken to the next page to configure which space this template should be used in. Be sure to select the workspace(s) you wish to receive our notifications in; multiple spaces can be selected here. Then, click on the “Next” button to finish importing the Flow.
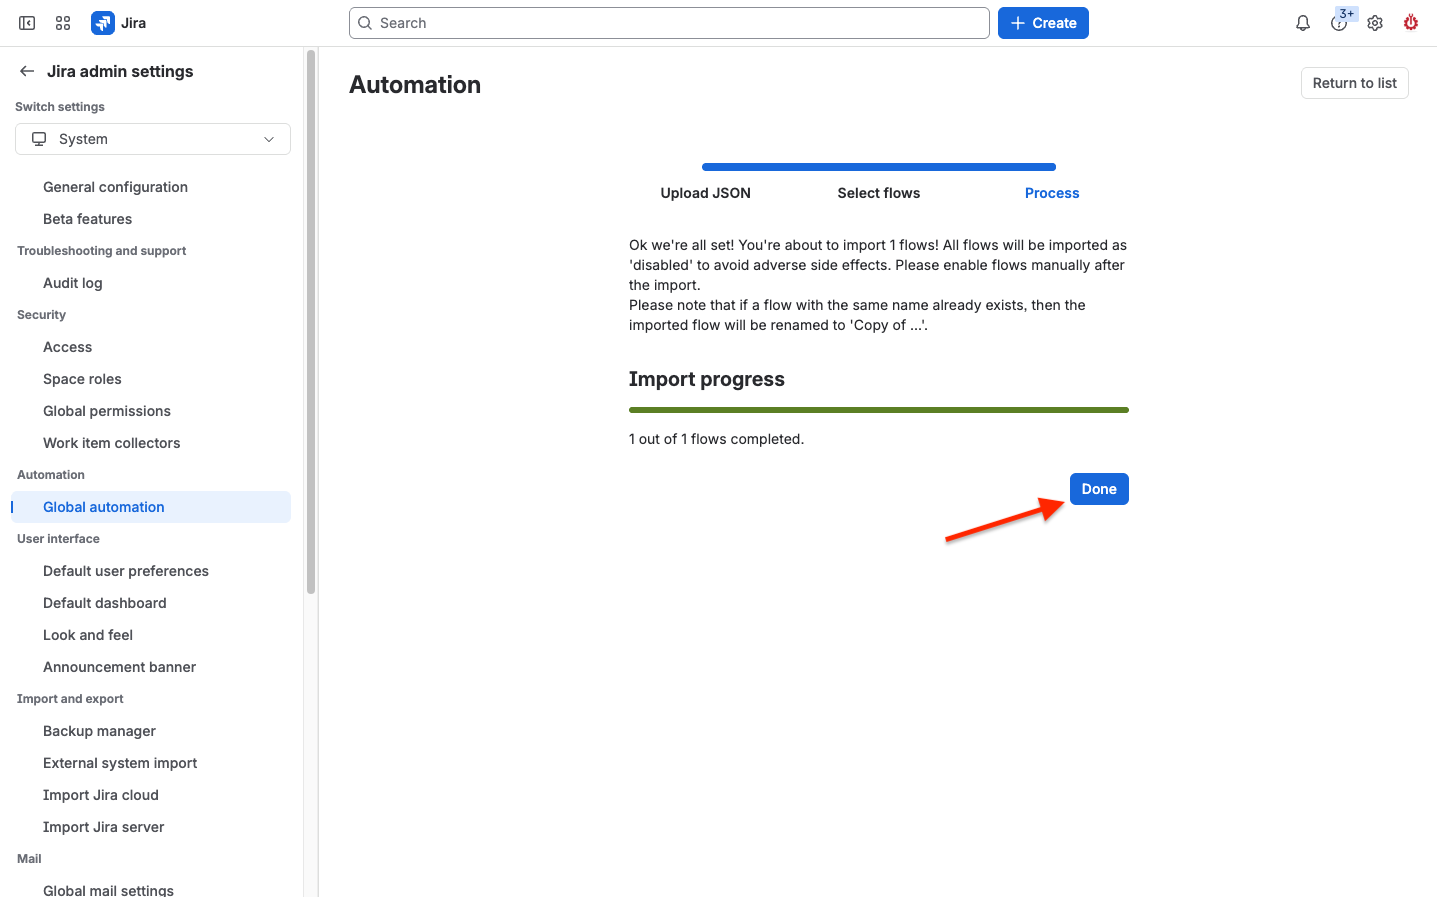
You will be taken to a screen confirming the Flow has been imported. Click on the “Done” button here.
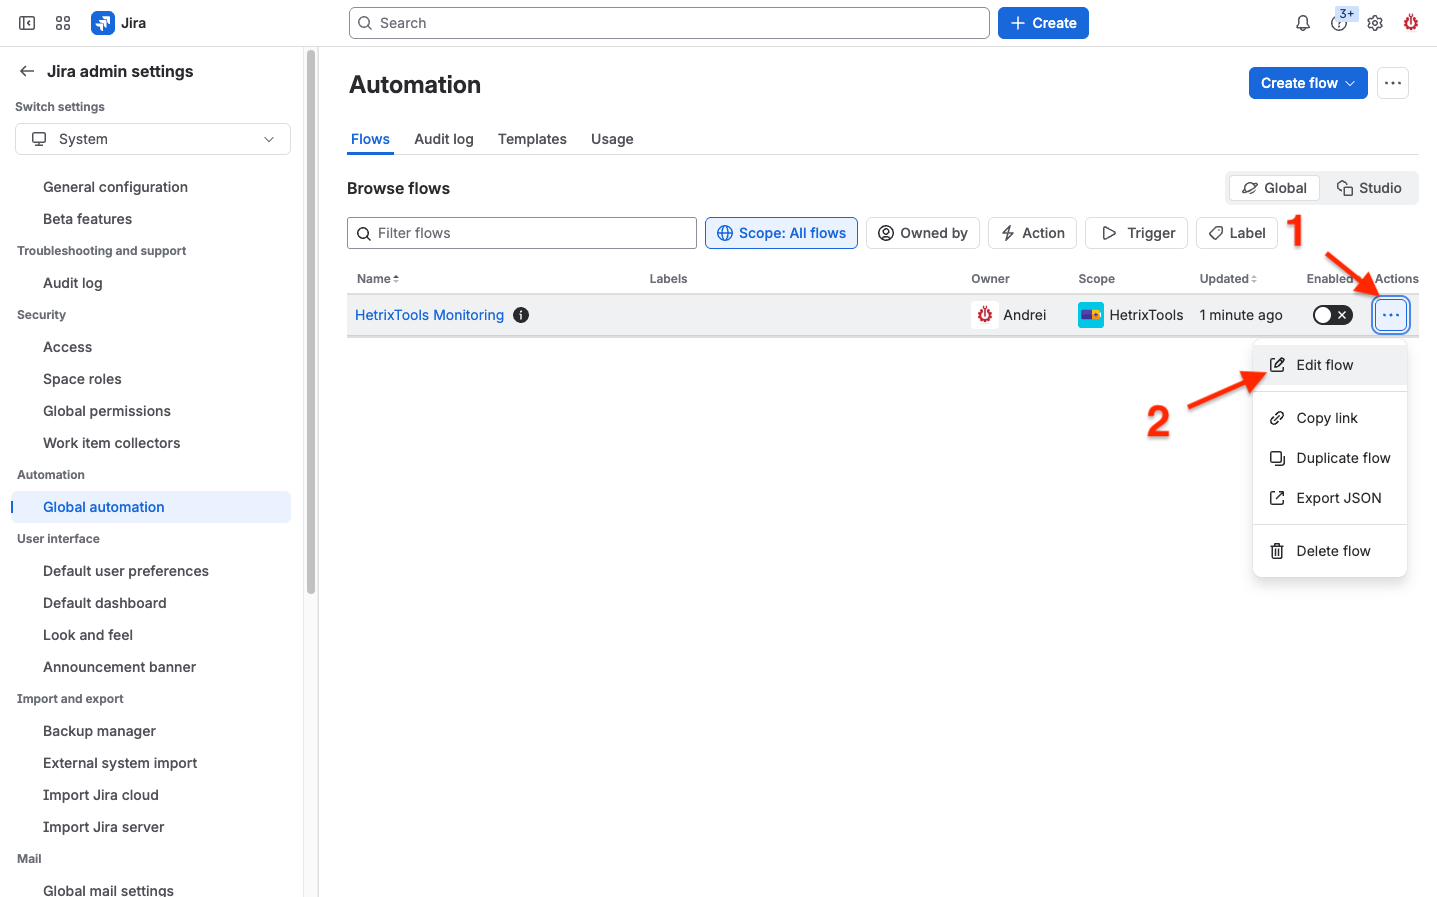
Next up, you will be taken to your flows page where you can see the new “HetrixTools Monitoring” Flow. Click on it’s “Actions” drop-down menu and select “Edit flow”.
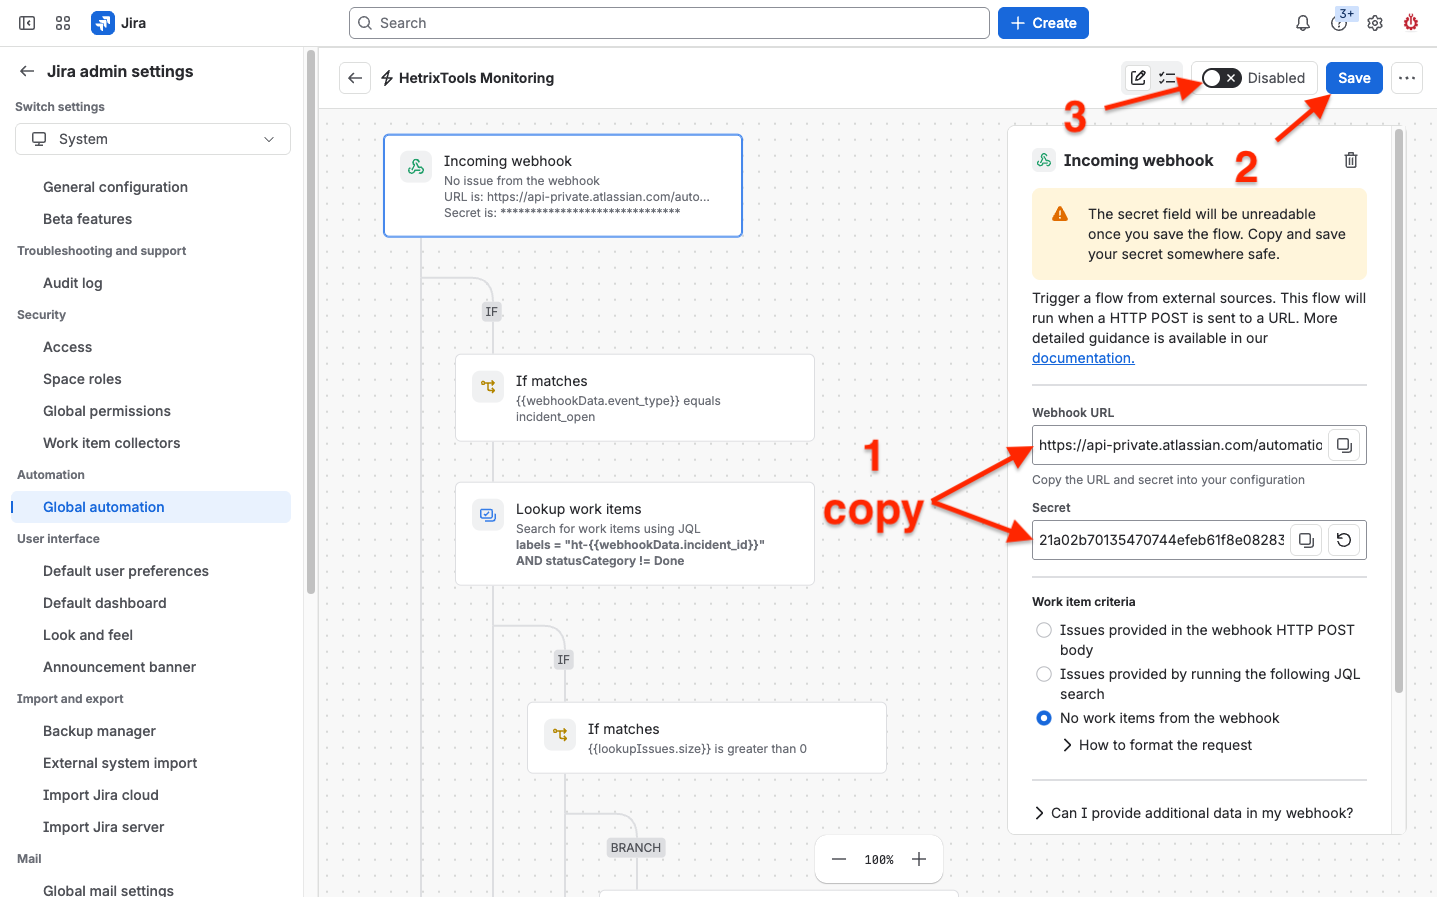
On the flow edit page, click on the very first item, “Incoming webhook,” and then click on the “Generate a new secret” button in its side panel.
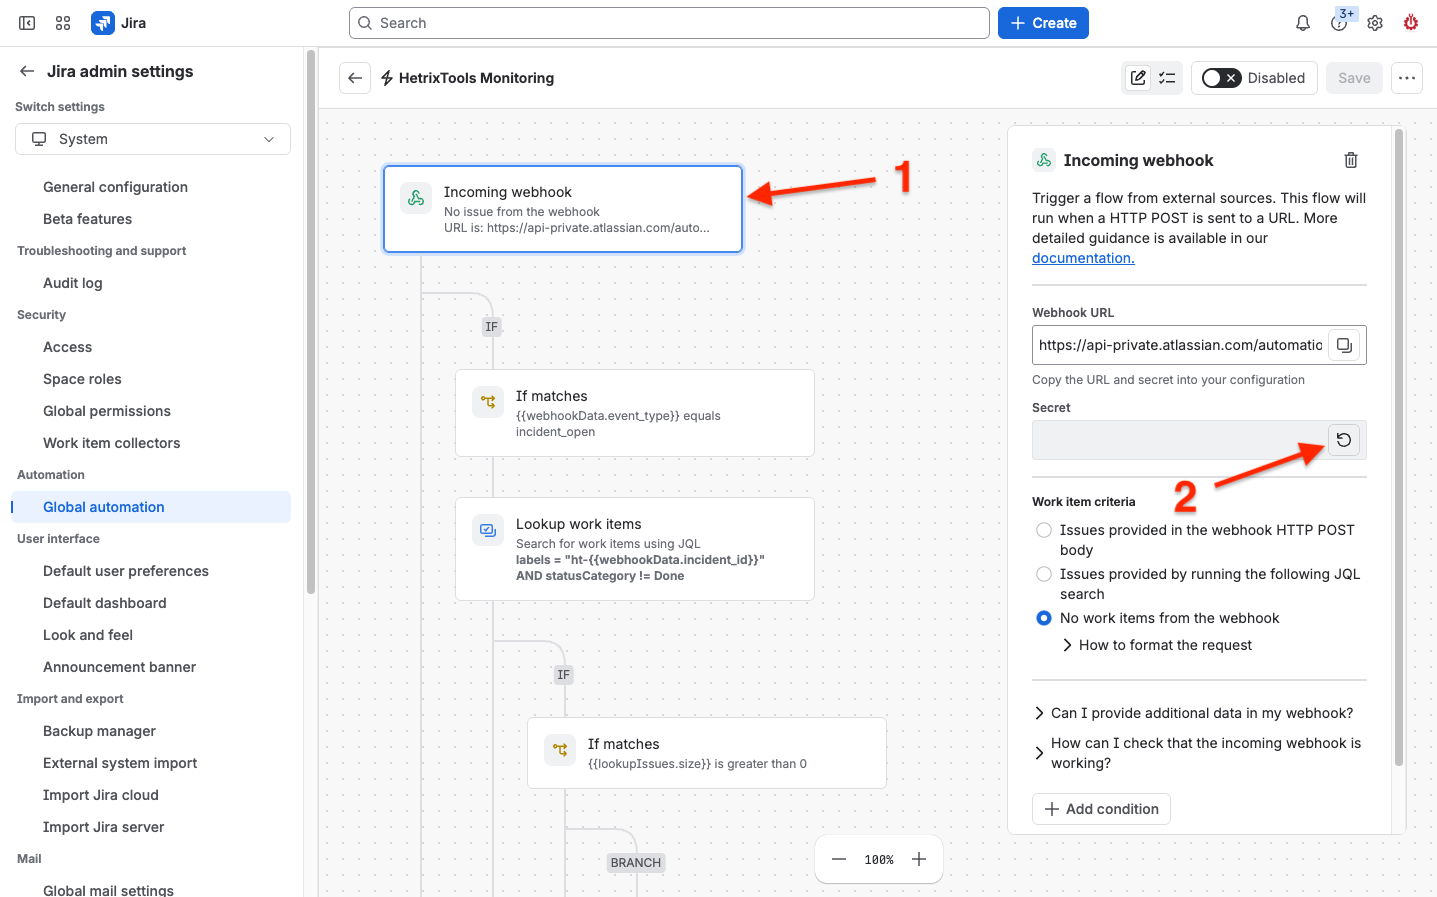
A new secret will be generated. Be sure to copy the “Webhook URL” and the “Secret” right away, as you won’t be able to see your secret again after leaving this page; you will need these when configuring the Contact List on our platform in later steps of this guide. Once you’ve saved your “Webhook URL” and “Secret”, click on the “Save” button to save the changes made to your flow. Wait for the flow saved confirmation to be shown, and then click on the “Disabled” toggle in order to enable this flow.
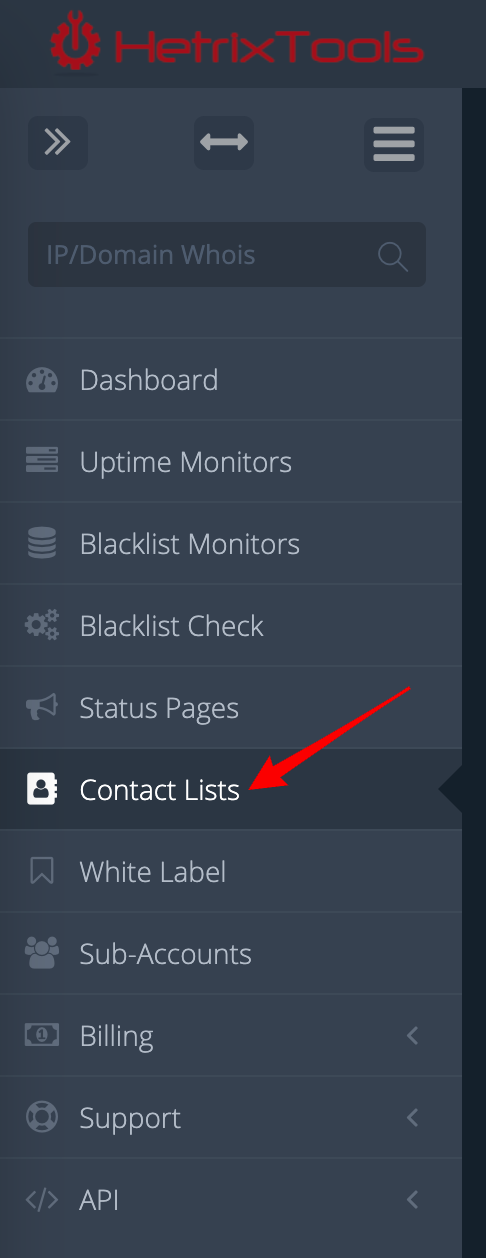
Now, on the HetrixTools platform, go to your Contact Lists dashboard from the side menu in your client area.
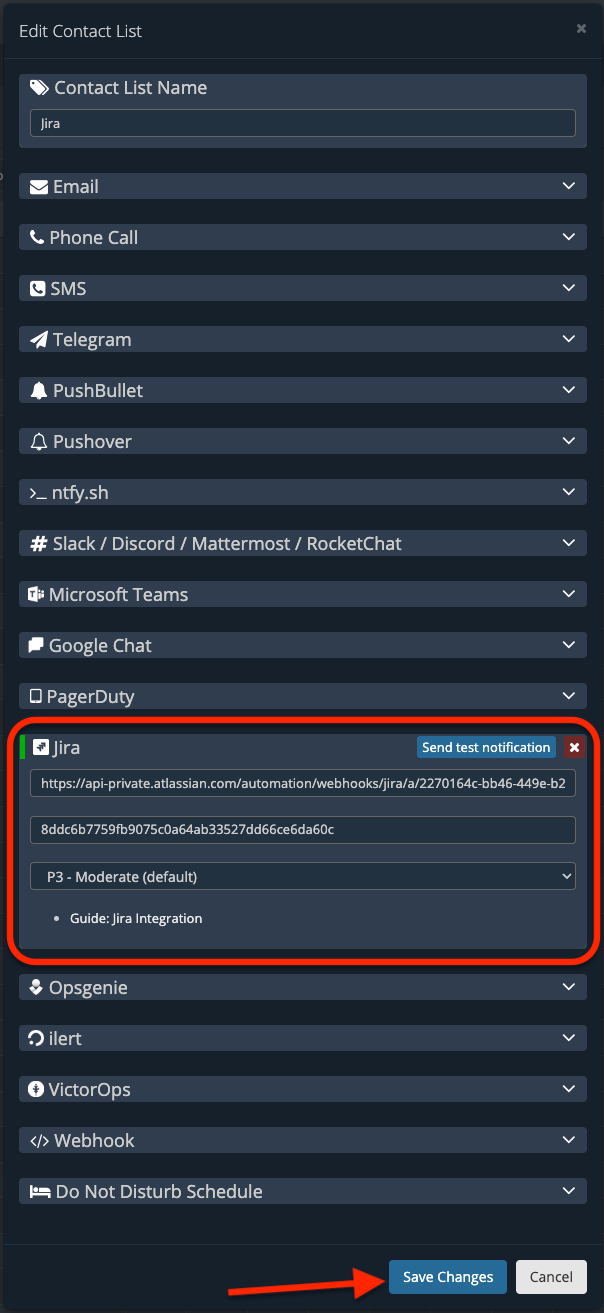
Here, either create a new Contact List or edit an existing one, and fill out the Webhook URL and Secret you’ve copied earlier in the Jira section of the Contact List. Then, save the changes.
And that’s it. Our platform will now open and close tasks in your Jira workspace for all of the monitors that have this Contact List assigned to them.