When accessing your Uptime Reports, you’ll be presented with multiple Uptime Percentage calculations for different periods of time for your Uptime Monitor. In this article, we’ll explain what each of them means and how they are calculated.
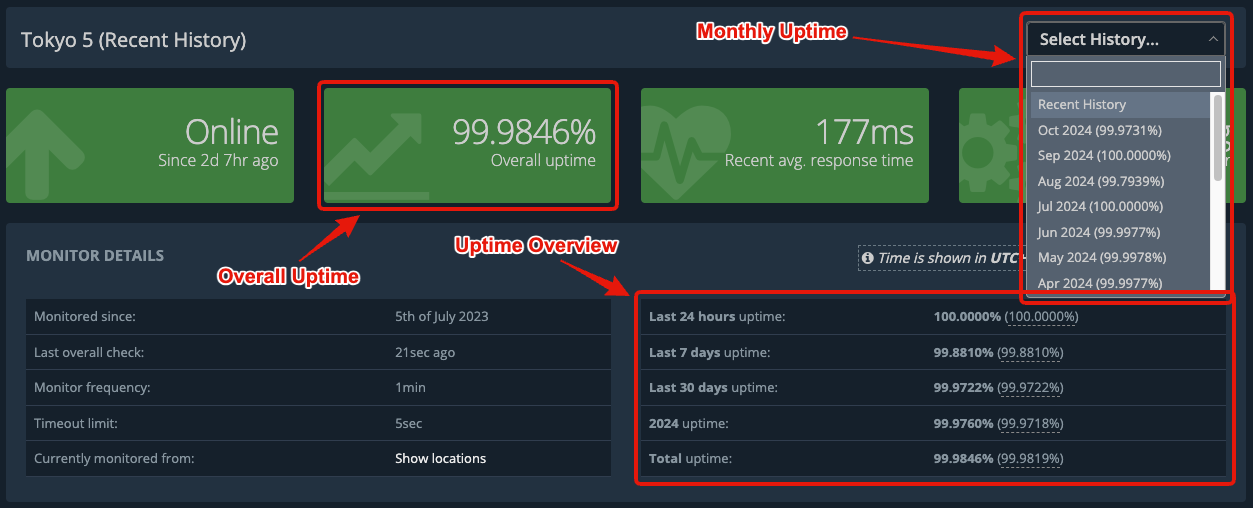
Overall Uptime
This is the simplest one of all; it averages the uptime percentage for all of the months since your Uptime Monitor was active (see monthly uptime below). The uptime history is kept indefinitely for both free and paid plans alike. However, you can always reset your uptime history if you want to.
Monthly Uptime
This can be found in the drop-down menu on the top right side of your Uptime Reports, and it contains all of the months in which your Uptime Monitor has been active.
Each calendar month takes into account all of the days in that month, and its uptime percentage is calculated based on how many minutes of downtime your monitor has experienced within that particular month. This uptime percentage takes into account the entire month regardless of when you have added your uptime monitor within that month (for example, if you add your uptime monitor to be monitored on May 25th, the entire month of May is taken into consideration, not just the last 7 days of May).
We have chosen this method because, given the weight each monthly uptime has in your overall uptime percentage, adding your monitor to our platform early on in the month or later on in the month would yield different monthly uptime percentage for that initial month given the same exact downtime, which we think isn’t really fair. So, the method that we have chosen will consider the entire month, no matter when during the month you start monitoring your uptime.
Uptime Overview
This panel contains an overview of multiple uptime percentages, as follows:
- Last 24 hours uptime: calculates your Uptime Monitor’s uptime based on how much downtime it has suffered within the last 24 hours, regardless of when you have started monitoring (i.e., even if you started monitoring within the last 10 minutes and have already suffered downtime, the uptime percentage is still calculated per 24 hours).
- Last 7 days uptime: calculates your Uptime Monitor’s uptime based on the past 7 days. If you only started monitoring less than 7 days ago, then your monitoring start date is taken into consideration in 1 day increments (i.e., if you started monitoring 20 hours ago, 1 day is taken into account for the uptime percentage calculation; if you started monitoring 26 hours ago, 2 days are taken into consideration, and so on up to 7 days).
- Last 30 days uptime: works just the same as the ‘last 7 days uptime’ calculation, except for 30 days.
- Yearly uptime: averages the uptime for all of the months in the displayed year.
- Overall uptime: is the same as the ‘overall uptime’ described at the beginning of this article.
The values displayed in brackets in the Uptime Overview panel are the uptime percentages, including downtimes suffered during maintenance windows. For more about this, please see:
https://docs.hetrixtools.com/heres-how-maintenance-mode-affects-your-uptime-reports/
Conclusion
During the design of these calculations, we split the uptime percentages into two main categories:
- Short-term uptime: (i.e., last X days uptime) used to determine the monitor’s recent uptime percentage.
- Long-term uptime: (i.e., monthly/yearly uptime) used to store and archive the monitor’s uptime percentage indefinitely.