As explained in our Maintenance Mode article, all downtime which occurs while this Mode is active will be shown separately in your Uptime Reports.
Here’s what to look for in your uptime reports.
1. In the monitor details section of your uptime report you can easily spot two separate statistics for your uptime percentages.
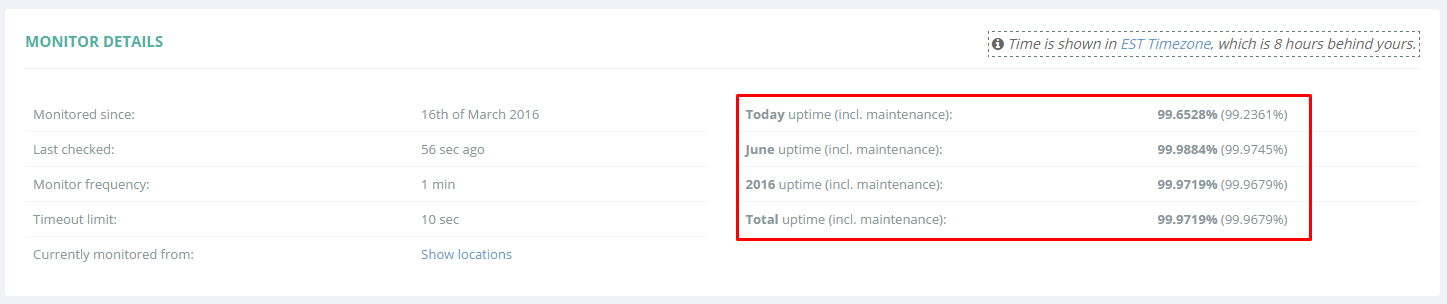
The bold text represents your uptime percentages without including all of the downtimes that occurred while under maintenance mode, while the uptime percentage from within the brackets will include your overall uptime statistics (with and without maintenance).
2. In the recent uptime section you will notice the daily downtime minutes, separated for maintenance and non-maintenance.
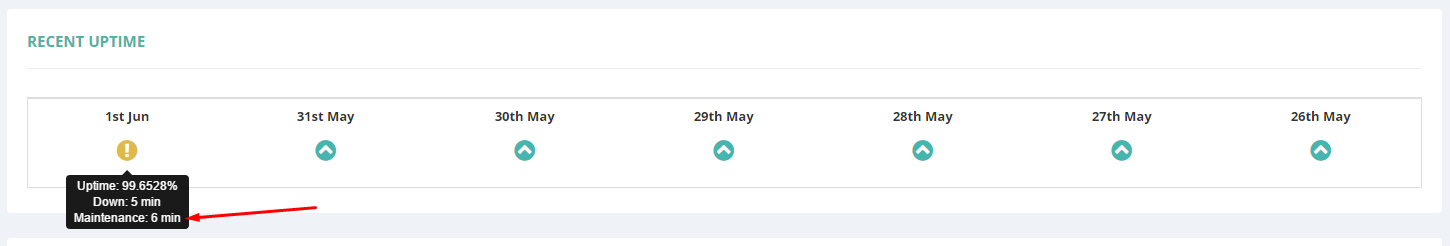
The uptime percentage in this tooltip represents the uptime without maintenance, downtimes included.
3. In the recent downtimes section, the downtimes that occurred under maintenance will have a key wrench besides them, so you can easily spot them.
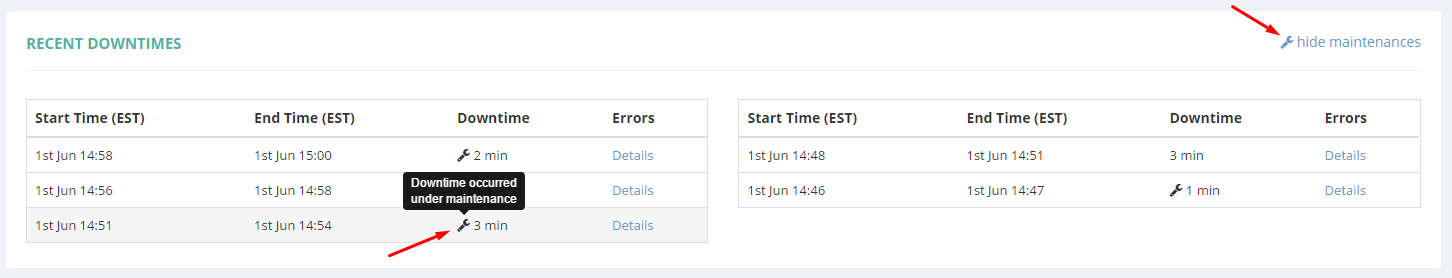
You can also hide all of the maintenance downtimes in this section by using the “hide maintenances” link from the top right side of this section.
If you switch your Uptime Monitor to Maintenance Mode while an outage is still in progress, our system will keep track of the non-maintenance downtime and the maintenance downtime separately, so it can then precisely reflect the event in your uptime reports.
For instance, if your Uptime Monitor goes offline while not being under Maintenance Mode, and it has already been down for 5 minutes when you switch it to Maintenance Mode, then another 10 minutes pass and it comes back online, the end result will be 5 minutes of non-maintenance downtime and 10 minutes of maintenance, adding up to 15 minutes of downtime.