Using this filter feature you can easily see only the Uptime Monitors that require your attention.
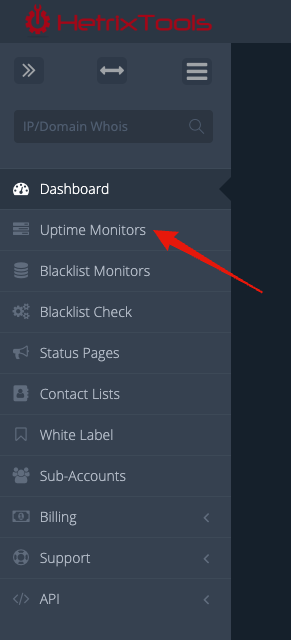
To get started, head to your Uptime Monitors dashboard from the top side menu in your client area:
On this page, locate the ‘Filter’ drop-down menu on the top right side of the panel, and select ‘Based on Warnings’, after which simply select the warning level you wish to see:

Warning levels that may be associated with your Uptime Monitors:
- Info (blue warning sign) – this is the lowest warning level, and it is triggered by non-priority events, such as, but not limited to, your server requiring a reboot to finish installing updates.
- Warn (orange warning sign) – this is the middle warning level, and it is triggered by non-critical events that require your attention, such as, but not limited to, domain/ssl expiring in the near future.
- Critical (red warning sign) – this is the highest warning level, and it is triggered by events that require your immediate attention, such as, but not limited to, drive or RAID failure, domain/ssl expiring in the immediate future.
You can, of course, configure alerts to be sent to you for any and all of these events. The warning signs mentioned above are for display purposes only, in your Uptime Monitors dashboard, so that you can easily spot the servers that require your attention.