[July 12, 2016 – UPDATE]
The Singapore uptime monitoring node has now been replaced, so you should start seeing Downtime Diagnostics being recorded from this location as well, from now on.
You can always find the current list of Uptime Monitoring Nodes here:
https://docs.hetrixtools.com/uptime-monitoring-nodes/
[July 11, 2016 – UPDATE]
Due to restrictions on Microsoft’s Azure network, our following uptime monitoring nodes cannot collect downtime diagnostics:
- San Francisco – node 1
- Amsterdam – node 1
- Singapore
For San Francisco and Amsterdam, the downtime diagnostics get collected from the secondary nodes in those locations, while in Singapore we currently have just one node, so no downtime diagnostics are currently available in this location.
In the near future we’ll work on either moving these nodes off Azure or spawning additional nodes on different networks.
[July 11, 2016]
In this version we’re introducing Downtime Diagnostics for our Uptime Monitoring service.
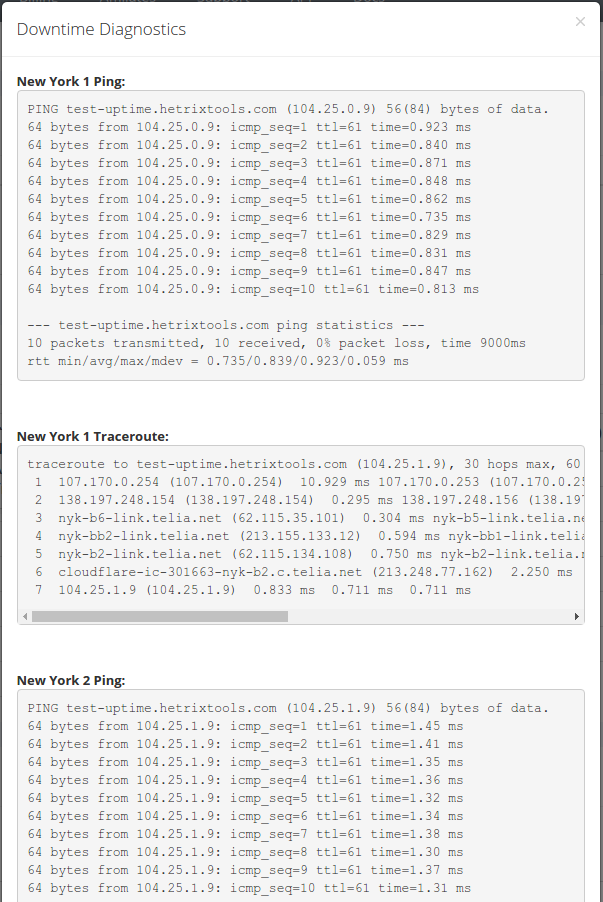
What this does, is basically take a sample ping and traceroute from each monitored location when your Uptime Monitor goes down, and logs this info neatly in your Uptime Report. You can then use this information to figure out what has caused the downtime.
Downtime Diagnostics is enabled on all of our Uptime Monitors, by default, regardless of which package you are on.
By default, only the uptime report owner (while being logged in) can view the Downtime Diagnostics on the report page, you can change this in any monitor “Advanced Settings” and make the diagnostics publicly available.
For further info on this new feature, be sure to check out the documentation article:
https://docs.hetrixtools.com/downtime-diagnostics/
If you experience any issues with this feature, please open a support ticket on our website and let us know about it.