[26 Sept 2023]
Today, we’re very excited to launch version 2.0 of our Linux Server Monitoring Agent:
https://github.com/hetrixtools/agent/tree/master
This new version has many improvements compared to our agent’s previous (v1) version, and we’ll go through some of the more noticeable changes below.
Server Info
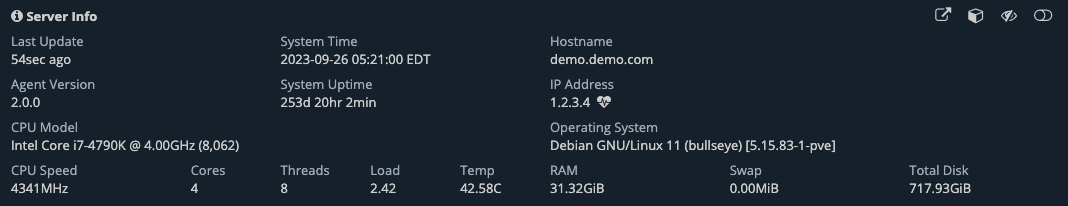
This section’s layout has been slightly redesigned to make room for more info:
- server’s time is now being monitored and if it falls too much off, you’ll see a warning sign next to it
- server’s hostname
- improved CPU model detection for ARM CPUs
- CPU speed/frequency has been redesigned agent-side to be collected more granular instead of just once per minute, resulting in a more accurate reading
- CPU cores/threads
- CPU load
- CPU temperature (where available)
CPU Usage
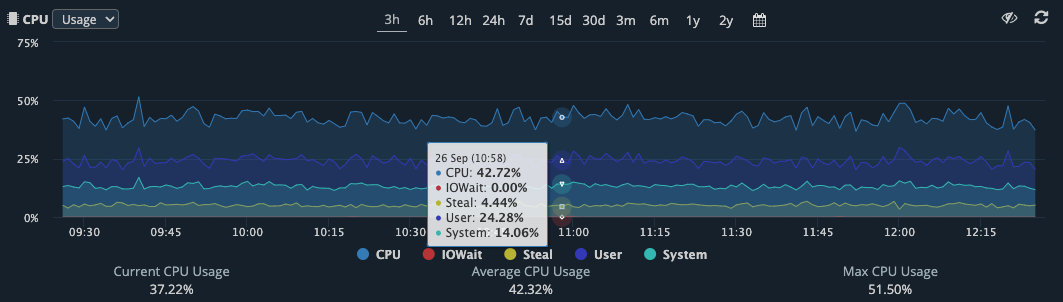
The CPU usage graphs now include new data for the following:
- CPU Steal Time
- CPU System Time
- CPU User Time
You can also configure warnings for CPU Steal time in addition to the existing overall CPU usage and CPU Wait Time.
CPU Load
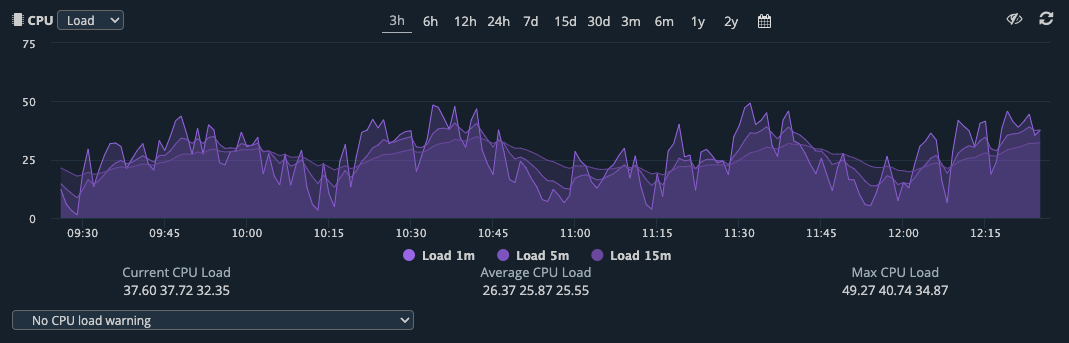
We’ve introduced a new section tracking the CPU Load for the 1m, 5m, and 15m values.
You can also now configure warnings for when the CPU Load exceeds your defined threshold.
The CPU Load section will be private by default, but you can choose to display it on your public Uptime Reports by modifying its privacy: https://docs.hetrixtools.com/resource-usage-privacy/
You can easily switch between the CPU Usage panel and CPU Load panel from the drop-down menu on top of these two panels:

Your selection will be remembered until changed again.
To view both the CPU Usage and CPU Load panels side by side, at the same time, click on the CPU tab (located above these panels):

RAM Usage
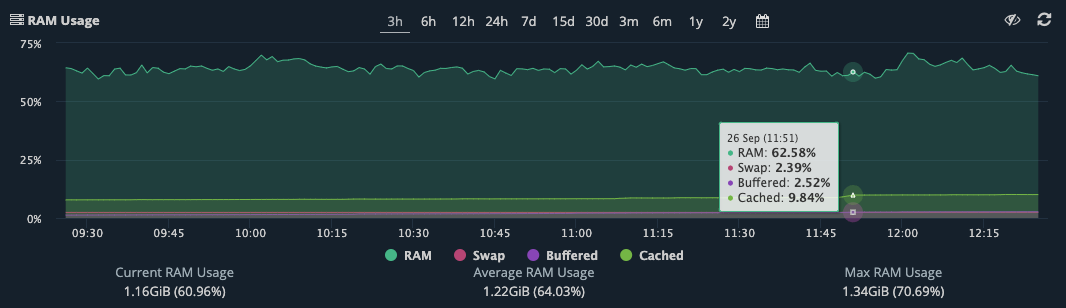
This section now contains new data for the following metrics:
- Buffered RAM
- Cached RAM
Network Usage
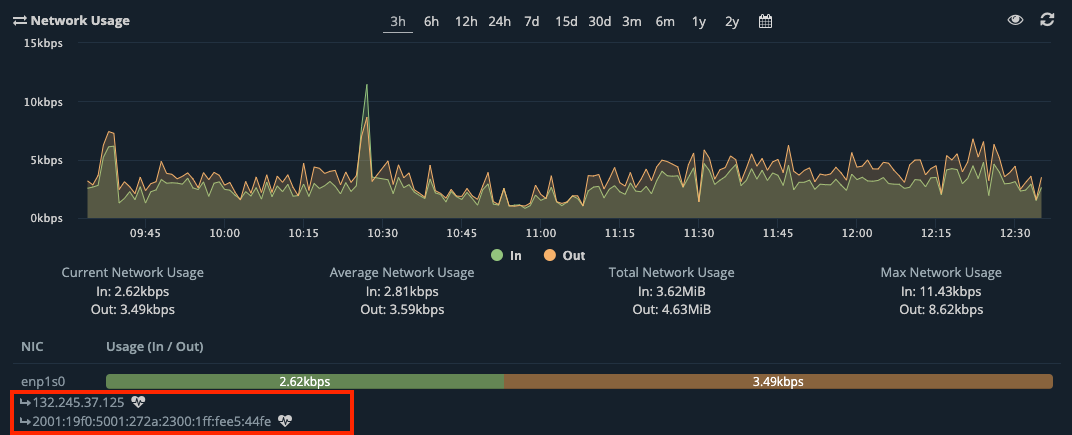
The agent will now try to detect your server’s IPv4 and IPv6 IPs, and they’ll be neatly displayed under each Network Interface in your Network Usage section.
You can quickly ping each of them with our Quick Ping feature.
Drive Health
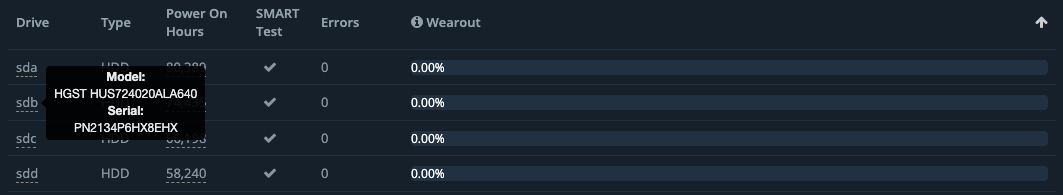
You can now click the names of your drives in the Drive Health section to reveal a persistent tooltip containing the drive’s Model and Serial. This should make it much easier to identify and replace faulty drives.
Uptime Monitors Dashboard
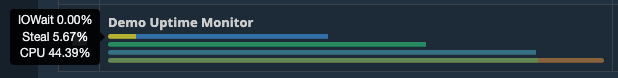
The brief Server Monitoring metrics displayed on your Uptime Monitors Dashboard will now display the CPU Wait Time and CPU Steal Time differently in order to have a quick overview of these important stats without having to open the entire Server Monitoring metrics panel.
You can also now order (ascending/descending) your uptime monitors based on CPU Steal Time.
Updating your agent
Updating your agent to v2 can be done with the following command:
sudo wget -qO- https://raw.githubusercontent.com/hetrixtools/agent/master/hetrixtools_update.sh | sudo bash
Your existing agent settings will not be lost.