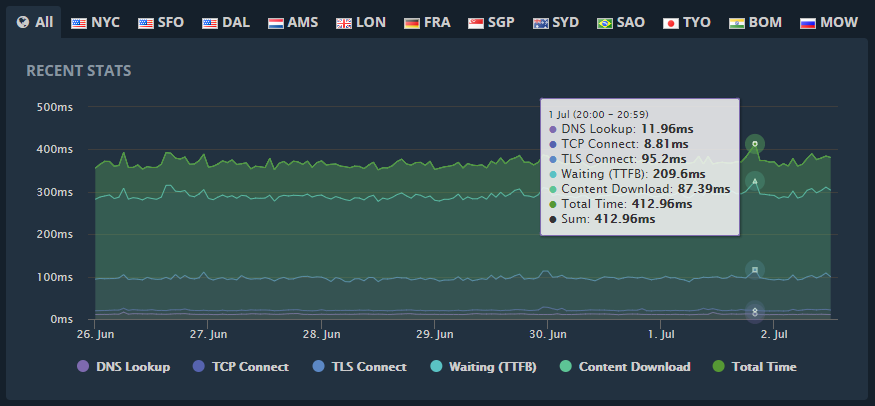
This feature is included for free in our Uptime Monitor service.

The advanced metrics can be found on your Uptime Reports for your Website Uptime Monitors.
They are collected every minute from each of the locations that you are monitoring your website from.
You can view the overall metrics, pooled together from all of the monitoring locations, under the “All” tab, or you can view them for each individual location by clicking on the respective location tab.
Displayed metrics:
- DNS Lookup – the time it takes to resolve your monitored domain/hostname.
- TCP Connect – the time spent establishing the TCP connection.
- TLS Connect – the time spent negotiating and establishing the SSL connection.
- Waiting (TTFB) – this is the time waiting for your monitored server to process the request and start the reply output (i.e. the time spent processing and generating the response page on the server). TTFB stands for Time To First Byte.
- Content Download – the time it took to download the response page content.
- Total Time – includes the sum of all previously mentioned items, which forms the total load time (i.e. the overall time it took for your monitored page to be loaded by our monitoring nodes).
- Sum – will represent the sum of the selected graph items, in the example screenshot above, all items are selected so the Sum is equal to the Total Time; however you can deselect any of the graph items in order to view only certain parts of the website loading process, in which case the ‘Sum’ will come in handy.
Please Note:
- The advanced metrics are collected every minute, but they are pooled together, based on each monitoring location, every 5 minutes, and displayed in hourly increments.
- The displayed time is incremental. For instance: the ‘TCP Connect’ is not the time since the very start of the process to the ‘TCP Connect’ finish, it’s the time from the ‘DNS Lookup’ finish until the ‘TCP Connect’ finish (i.e. the actual time it took to establish the TCP connection). This way, all of these metrics summed together will represent your website’s total loading time.
- Our monitoring nodes will not load up dependencies (e.g. css/javascript/images) located on your monitored website, so the recorded advanced metrics are for the monitored page alone.
