Next to each one of your monitored websites or services, you have an “Action” button from where you can:
- access your white label report
- edit the uptime monitor
- make the uptime monitor either public or private
- put the uptime monitor into maintenance mode (with or without notifications)
- delete the uptime monitor
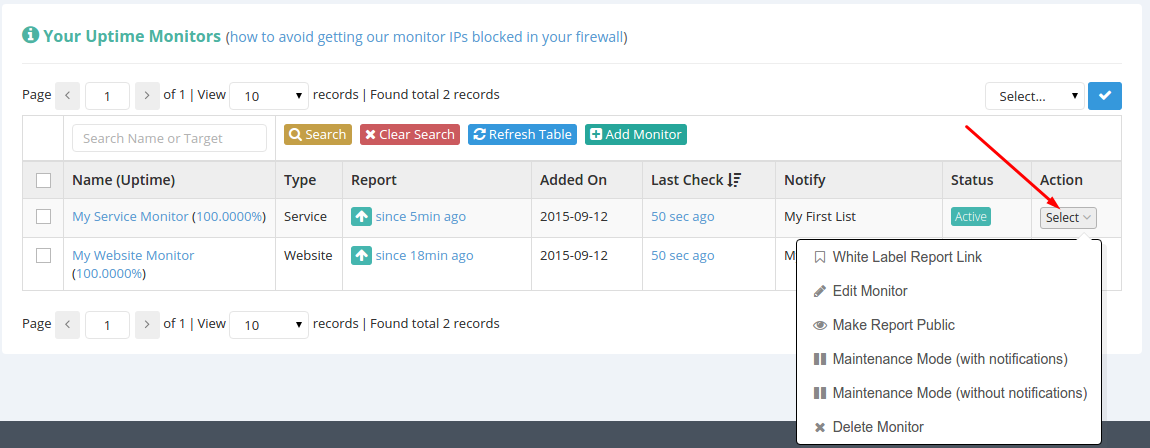
We’ll discuss all of these actions in the following chapters of our uptime monitors documentation.
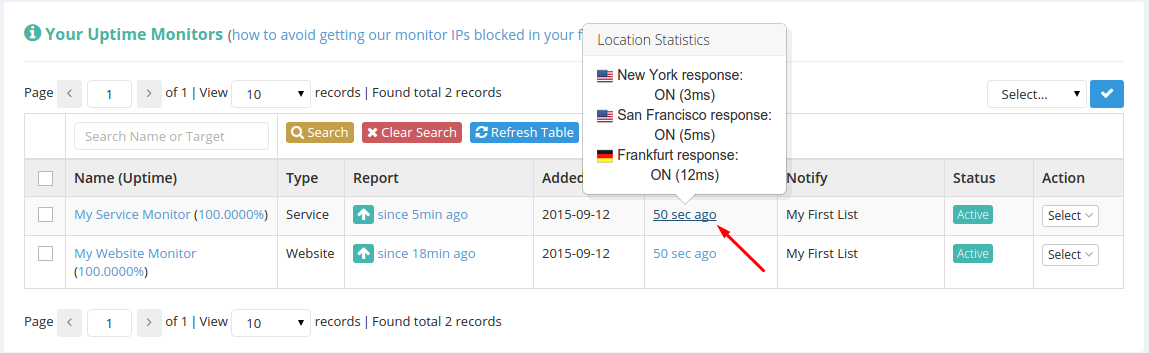
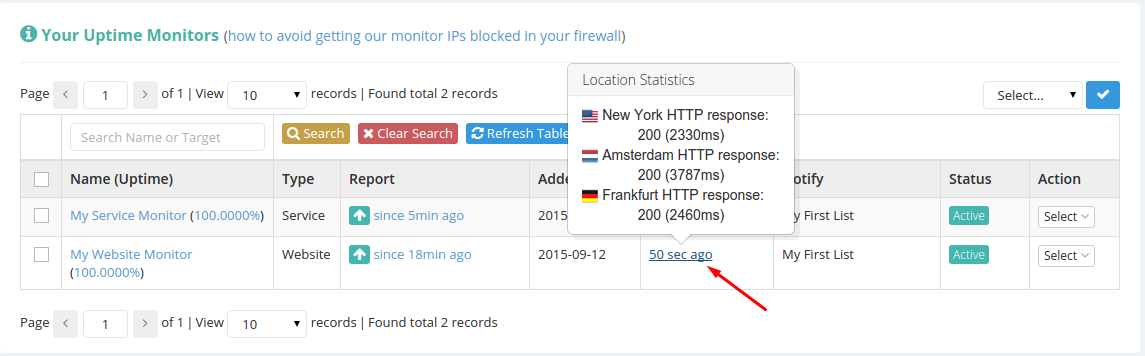
Clicking on the links in the “Last Check” column will show the last check results for each location that is monitoring your website or service.
Clicking on the links in the “Reports” column will take you to the non white label report for your uptime monitor.
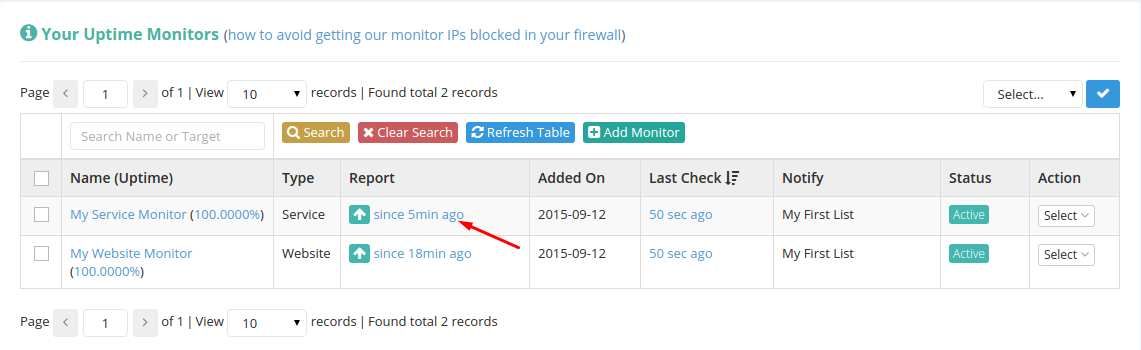
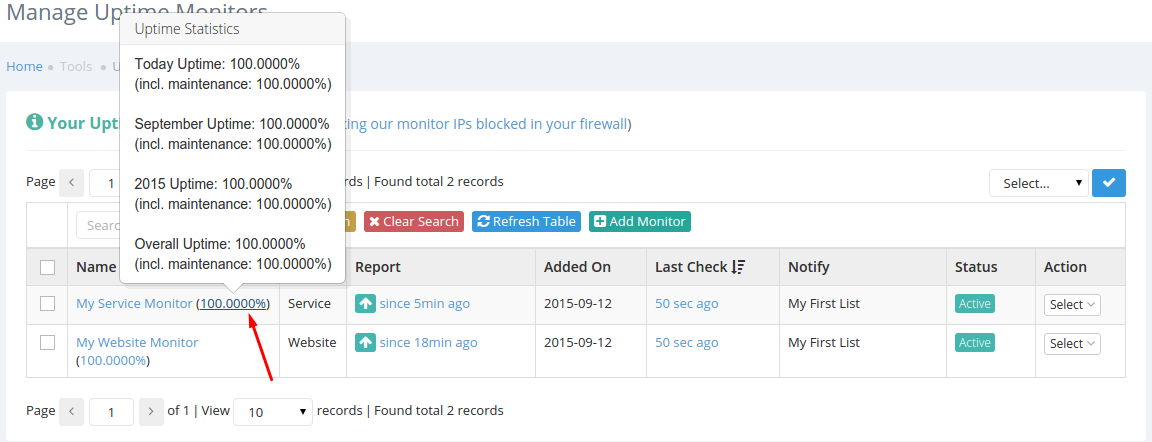
In the “Name (Uptime)” column you will find two links. The total uptime link will show additional uptime information regarding the current day/month/year uptime percentages.
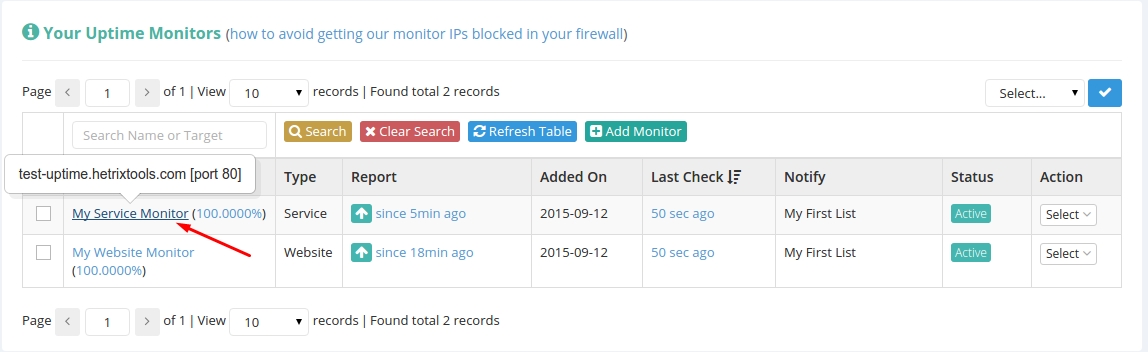
And clicking your uptime monitor name link will show either the link (for website monitors) or the hostname/ip (for service monitors) that is being monitored.