[June 21, 2022]
Summary
On June 21, 2022, at around 06:31 (UTC) our uptime monitoring system started detecting an unusually high number of errors from websites using Cloudflare.
At the same time, 3 of our 5 webservers, started experiencing issues when accessed via Cloudflare (as our platform is accessed by our users). The other 2 out of 5 webservers remained unaffected and continued taking on the user traffic load from the affected 3 webserver nodes.
Shortly after, Cloudflare acknowledged that they were having some issues, and posted the incident on their status page: https://www.cloudflarestatus.com/incidents/xvs51y9qs9dj
The outage lasted until 7:10 (UTC), after which Cloudflare started to slowly come back online.
Impact on HetrixTools and its services
Emails sent out spiked to over 10 times the usual numbers:
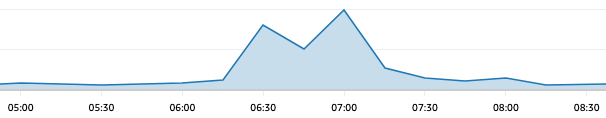
We did not experience any issues sending out this burst of emails, and as far as we can tell, all of our downtime detection emails were delivered in real-time to our users.
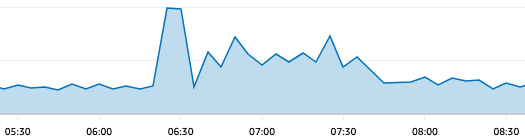
Uptime detected errors spiked to about 7 times the usual numbers:
Server Monitoring Agent
The metrics collection for our Server Monitoring Agent was the most affected part of our system, as it’s done entirely via Cloudflare. Only 25% of the monitoring agents that usually send data to our platform were able to send their metrics during this outage. However, we do have fail-safes in place just for such events and they suppressed alerts regarding your agent not sending data and the alerts declaring your Heartbeat uptime monitor down (again for not sending data). This prevented a lot of possible false positive alerts from being sent out.
Uptime Monitoring
Our uptime monitoring probing nodes communicate both via Cloudflare and direct means, for redundancy, with each node being able to switch between the two if one has issues. So, our monitoring nodes had no problems communicating all of the outages. However, some of the probe nodes started to overload, causing some uptime monitors to take longer to process than the usual one minute, up to a maximum of a couple of minutes, until these probing nodes were automatically kicked out of rotation. Our system is designed to give timeouts to the probing nodes that are too slow to process their assigned tasks, so the unhealthy nodes aren’t assigned new tasks for a period of time. From what I can determine, most of the outages have been noticed at their exact time, with some having a delay of a few minutes at most.
User web access
As was expected when so many websites go down all at once, and so many users are affected, we had a significant spike in web access on our platform during this Cloudflare outage:
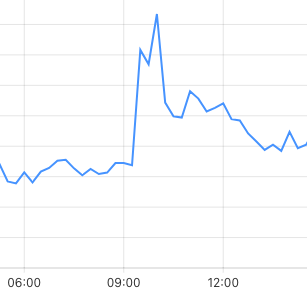
Our platform was up for the most part, as 2 out of our 5 webservers had no issues with Cloudflare during this outage, so they remained fully up and running, taking over the traffic load from the other 3 webservers. Both HetrixTools and the external monitoring services that we use only detected outages (via Cloudflare) for 3 of our 5 webservers during this Cloudflare downtime.
Blacklist Monitoring
This service was completely unaffected by this outage.
Documentation
Our documentation has been partially affected by the outage.
Conclusion
“Luckily” for us, this wasn’t the first major outage affecting an unusually high number of websites, and with each new outage, we try to improve the system more and more to be able to handle such events.
Even though our platform remained functional for the most part, we’ll be going through everything that happened during this event carefully to see what more we can improve for the future.