Having your Bulk Report neatly organized is a very important thing if you plan on using it as your public uptime status page. Now you can customize it even further by assigning Categories to your monitors.
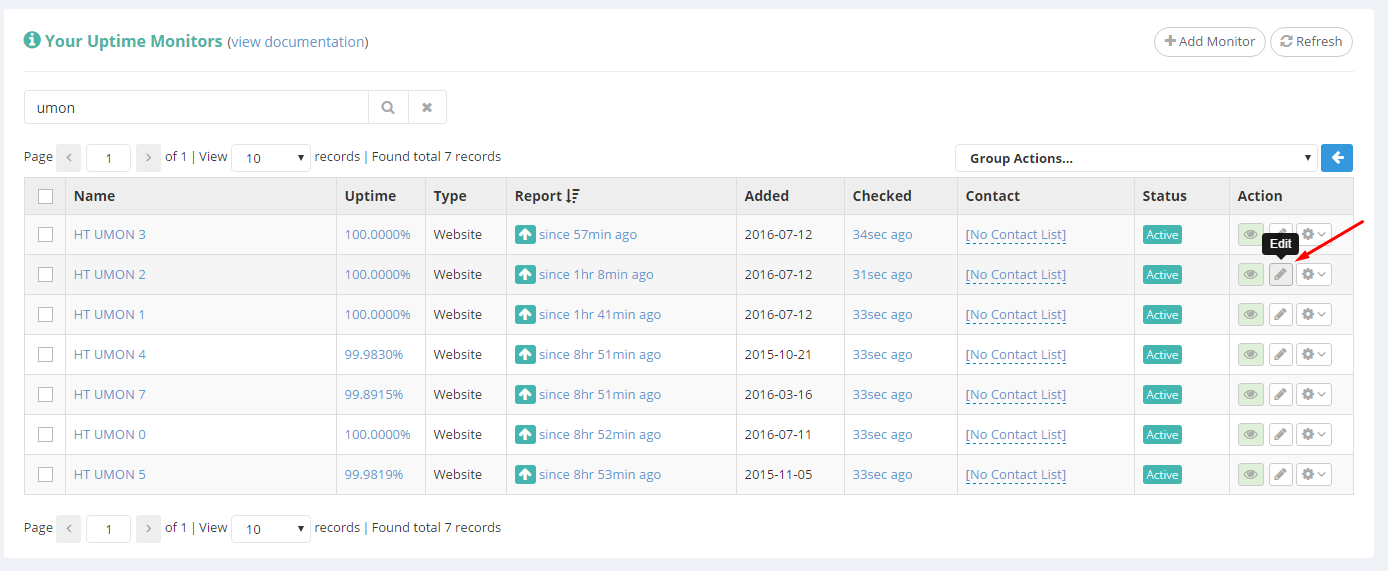
Start by editing or adding a new Uptime Monitor (in this example I’ll be editing).
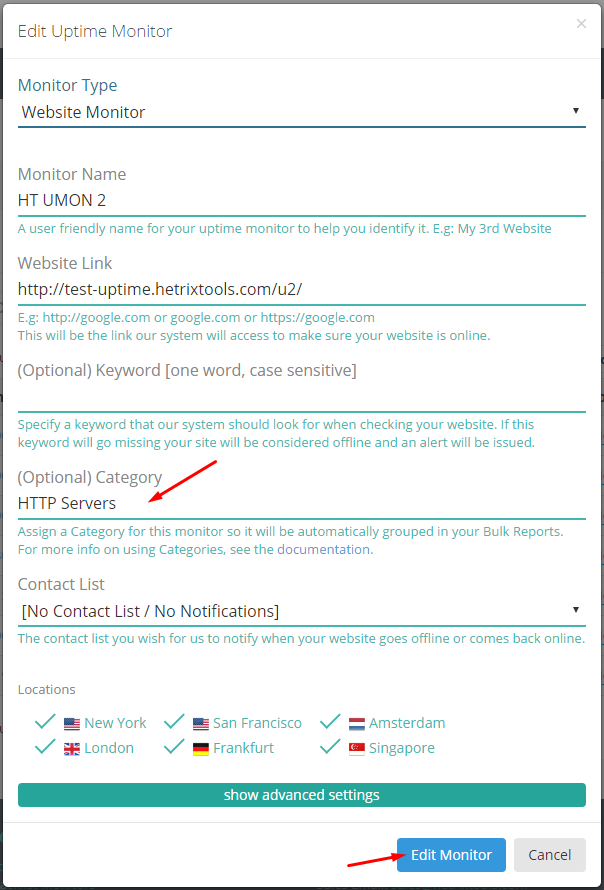
In the “Category” field, input the category name that this monitor will belong to, and save the changes.
Repeat this with all of the monitors that you wish to group up.
Once you’re done, if you haven’t already, bundle all of these reports into a Bulk Report (see how it’s done here).
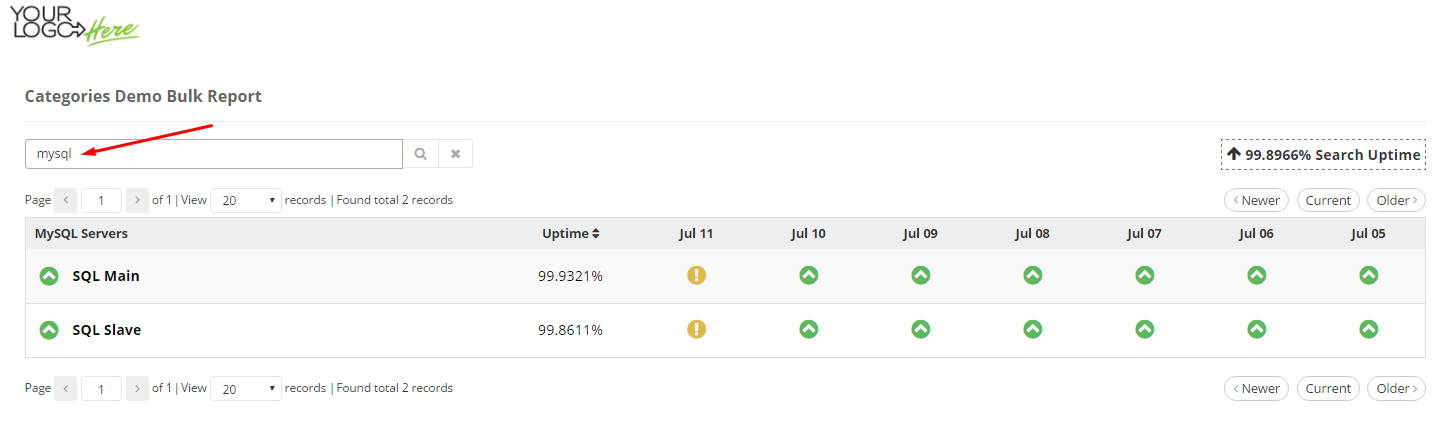
Now, let’s see how our Bulk Report looks like:
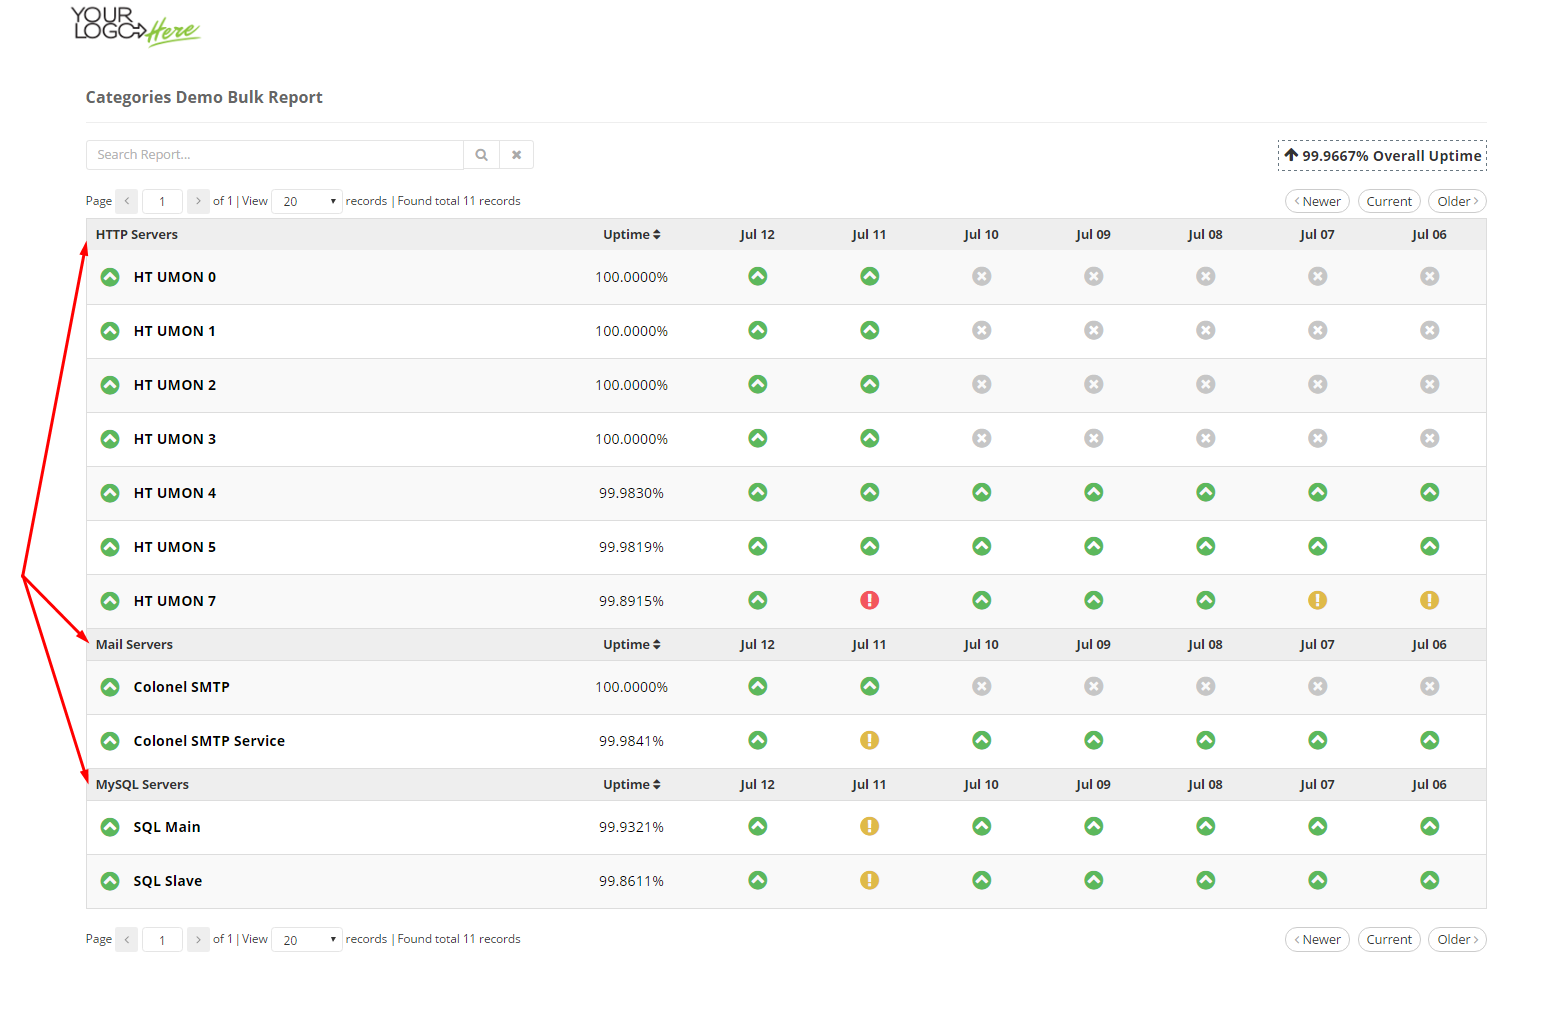
Notice that all monitors having the same category name have been grouped up nicely in your Bulk Report.
This way you’ll be able to group up different type of servers in your bulk reports.
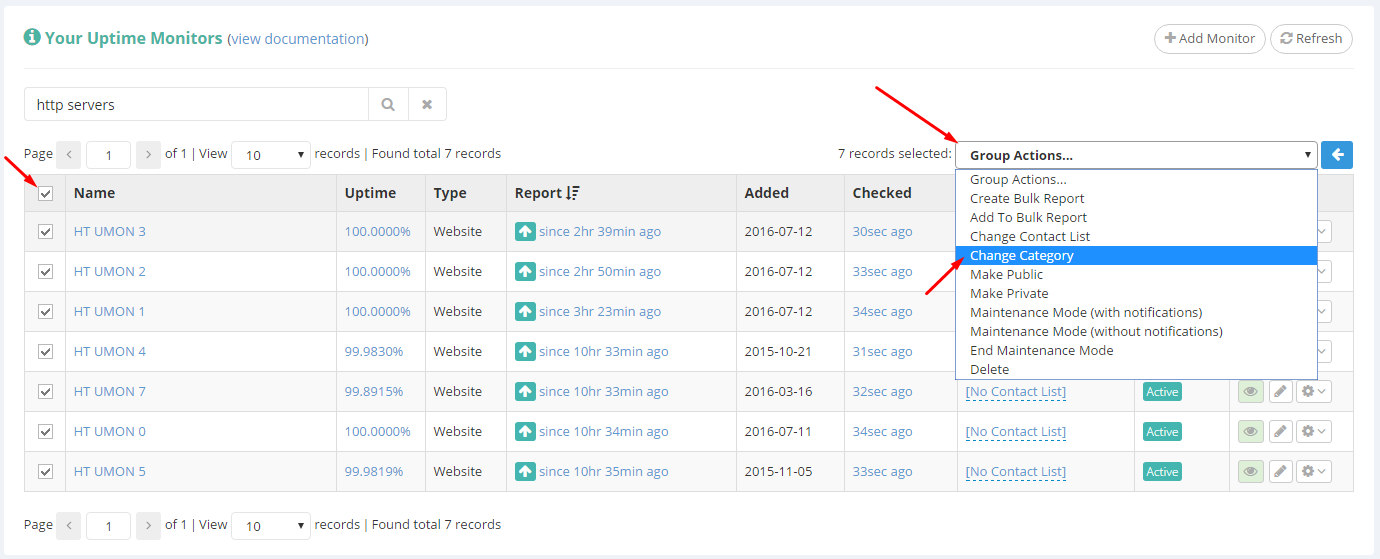
You can also change the Category of multiple monitors at once, by using our Group Action feature. Simply select the desired monitors and select “Change Category” from the group actions drop-down menu:
Furthermore, we’ve improved the search to include Categories now. So you can also search by category name in your dashboard monitors list and within your bulk report.

By default, categories are ordered alphabetically, but you can customize their display order in your Bulk Report. Please see the following article in order to find out how:
https://docs.hetrixtools.com/how-to-order-categories/
Please note:
- categories are always sorted ascending by name. If you wish to custom sort them, you’d need to assign numbers to their names (i.e.: 01 MySql Servers, 02 HTTP Servers, 03 Mail Servers, etc.).
- you don’t have to re-create bulk reports every time you modify a monitor’s category. The changes will take effect in any bulk report the monitor belongs to.