The Problem
You’re in the middle of upgrading your server fleet, and you’d like to have a quick look at the current status and your overall progress with this task.
The manual solution would be to go to your HetrixTools dashboard and manually open the server metrics for all of your uptime monitors, then note down each of their current OS versions.
The MCP Solution
Just ask your favorite AI to do it for you.
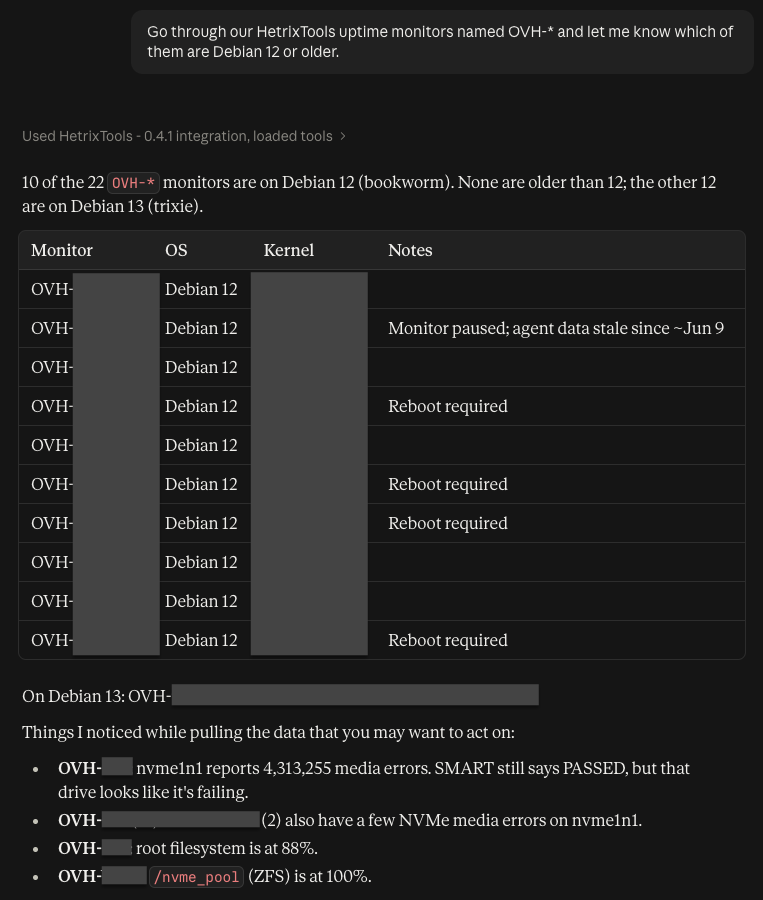
And you’ll be immediately presented with a quick-glance overview, including some extra info about your fleet that you might have missed or overlooked.
Let’s also quickly tag all of these servers so we can easily find them in our HetrixTools dashboard the next time we look for them.
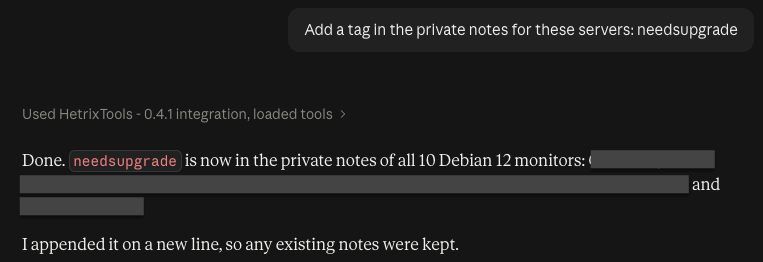
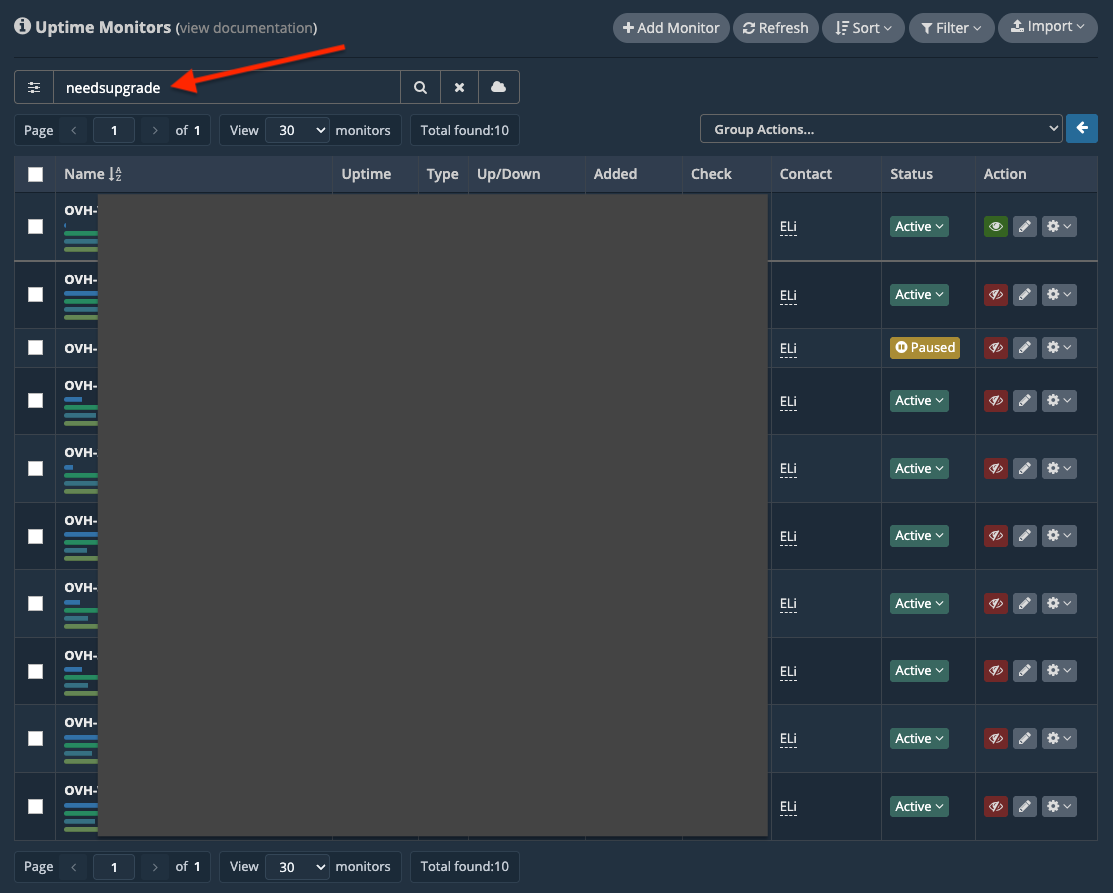
And just like that, all 10 nodes are now tagged and easy to find in our HetrixTools dashboard.