In any of your Uptime Monitor reports you’ll find the following uptime statistics (example screenshot):
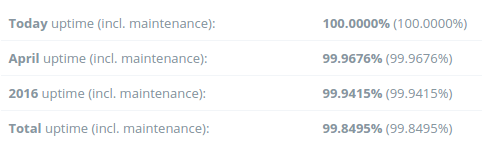
We’ll go through what each of them means and how they are calculated and displayed.
The “Today” uptime is calculated based on how many minutes of downtime your uptime monitor has had during the current day, considering each day has 1440 minutes.
The monthly uptime is calculated based on how many days are in that specific month, multiplied by 1440 minutes in every day, and compared to how many minutes your uptime monitor has been offline during the month’s period.
The yearly uptime is calculated based on the months included in that year and those months’ uptime statistics.
The total uptime is calculated based on all of the months we monitored that specific uptime monitor for you.
The maintenance time is displayed separately, but calculated just the same as explained above.
In your Uptime Bulk Reports you will see an overall uptime percentage:

That uptime is calculated based on all the Uptime Monitors that are included in that specific Bulk Report.
If you search through an Uptime Bulk Report, the overall uptime percentage will turn into the search uptime percentage:
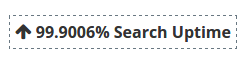
Which is the uptime percentage for just the search results displayed in your search.
Bulk Uptime Reports will display the Overall or Search Uptime percentages based on the overall uptime percentage of each Uptime Monitor included in said Bulk Report.