This feature is included for free in our Uptime Monitor service.
[Available on our Linux Server Monitor Agent Version: 1.5.3+]
https://github.com/hetrixtools/agent
Required software:
- To monitor the health of your disks, you need to have ‘S.M.A.R.T.’ installed on your server. It’s likely that you already have this package installed on your server, and if not, then it’s very likely it is already in your distro’s repository and it’s just one install command away from being installed. For more info, please see: https://docs.hetrixtools.com/how-to-install-s-m-a-r-t-smartmontools-on-your-server/
- In addition to ‘S.M.A.R.T.’ being installed on your server, if you wish to monitor the health of your NVMe SSD drives, you will also need to have the ‘nvme-cli’ package installed. Please see their GitHub page for more info: https://github.com/linux-nvme/nvme-cli#distro-support
Please note that our Server Monitoring Agent will not automatically install these tools for you.
You can configure our Server Monitoring agent to collect health data regarding your storage drives, HDD/SSD/NVMe.
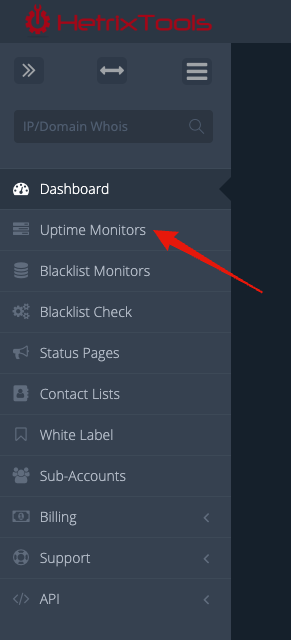
To get started, head on to your Uptime Monitors page in your client area:
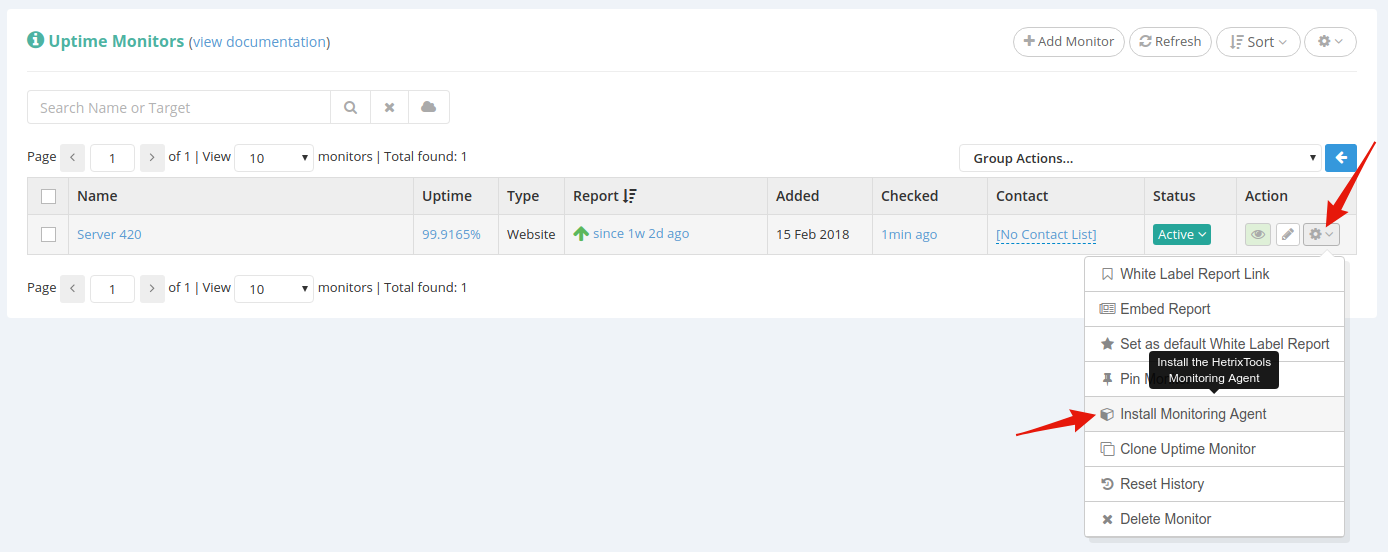
And add a Server Monitor to one of your Uptime Monitors:
On the installation code pop-up modal, select “Monitor drive health”:
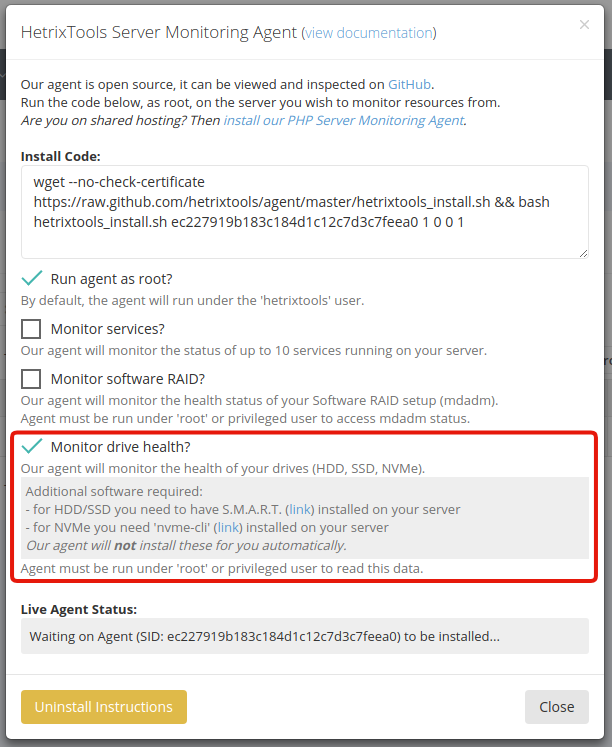
Then, run the installation code on your server, and wait up to two (2) minutes for the initial data to be collected.
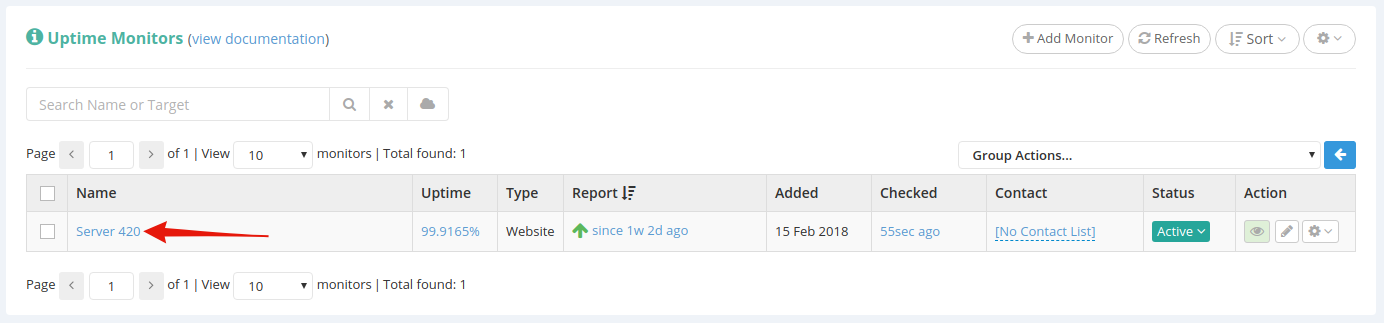
Once the first data is received by our platform, you can open up the Server Monitor stats, by clicking your Uptime Monitor’s name:
And then scroll down to the “Disk Usage” section:
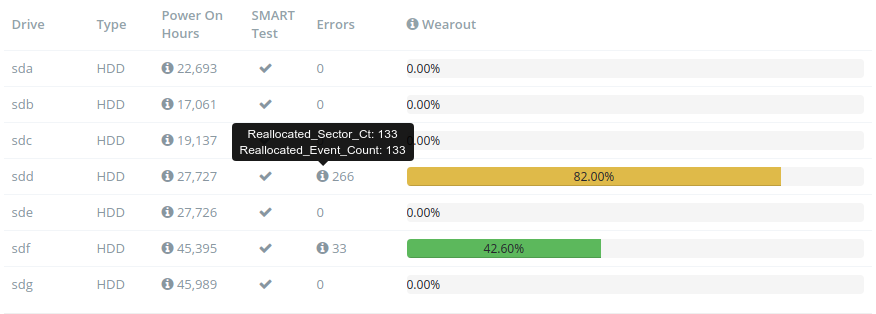
This is where you’ll find all of the server’s drives and their current health and wearout statistics.