In the following guide, we’ll demonstrate how easy it is to use our platform for your infrastructure management and the few basic steps you can take when performing planned maintenance on your servers.
We use our platform ourselves to monitor our non-impacting infrastructure components. The critical infrastructure components should always be monitored from multiple different sources/services, so for those, we also use other external monitoring services, other than our own platform and in-house built methods.
For the purpose of this guide, we’ll perform system upgrades on one of our uptime monitoring nodes in the Warsaw location.
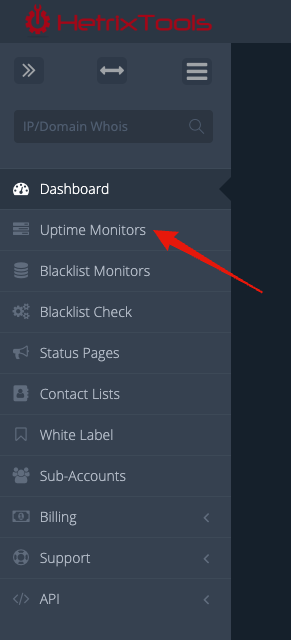
We start by going to our uptime monitors dashboard from the client area menu.
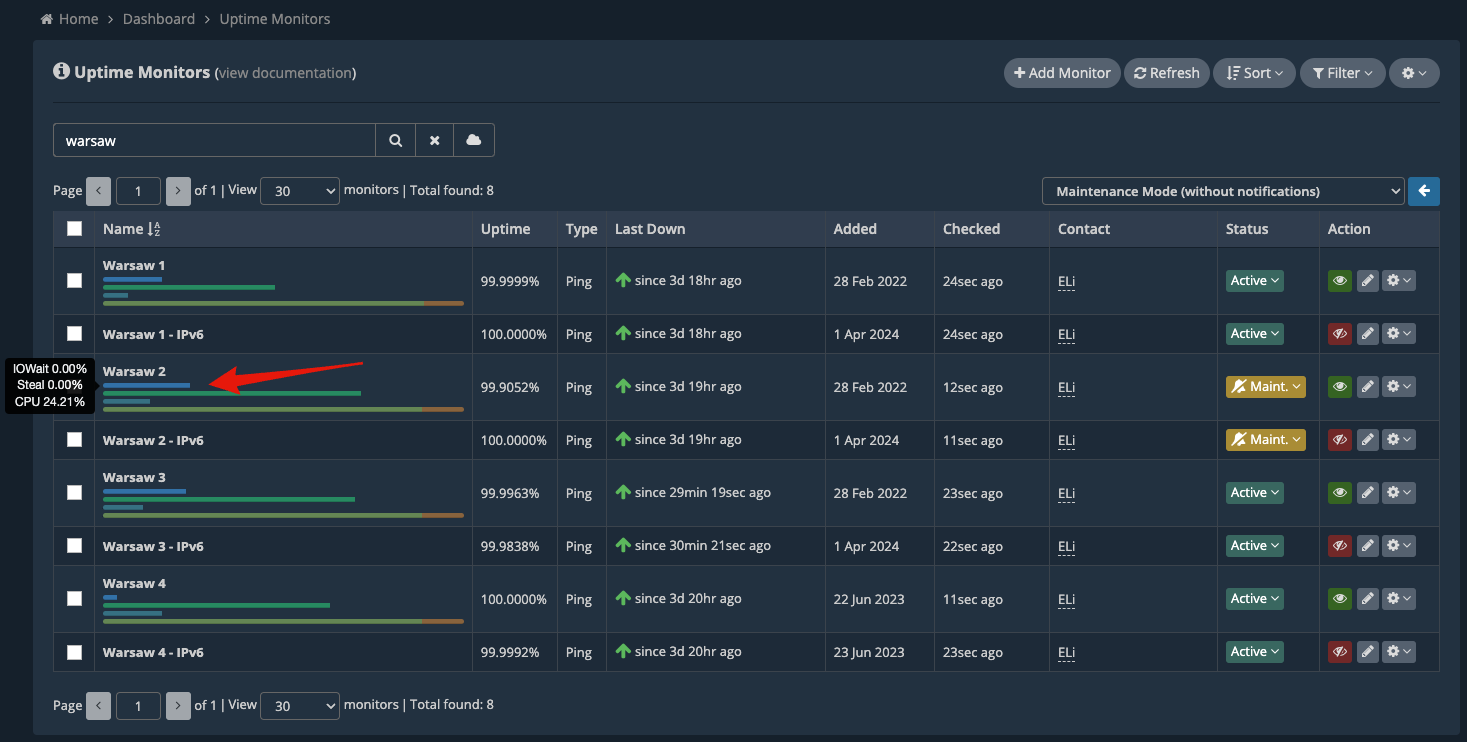
Search for the “Warsaw” uptime monitors.
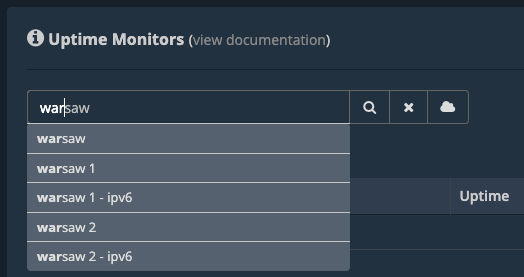
Now, only the Warsaw nodes are displayed on the dashboard, and this is what we’ll work with.

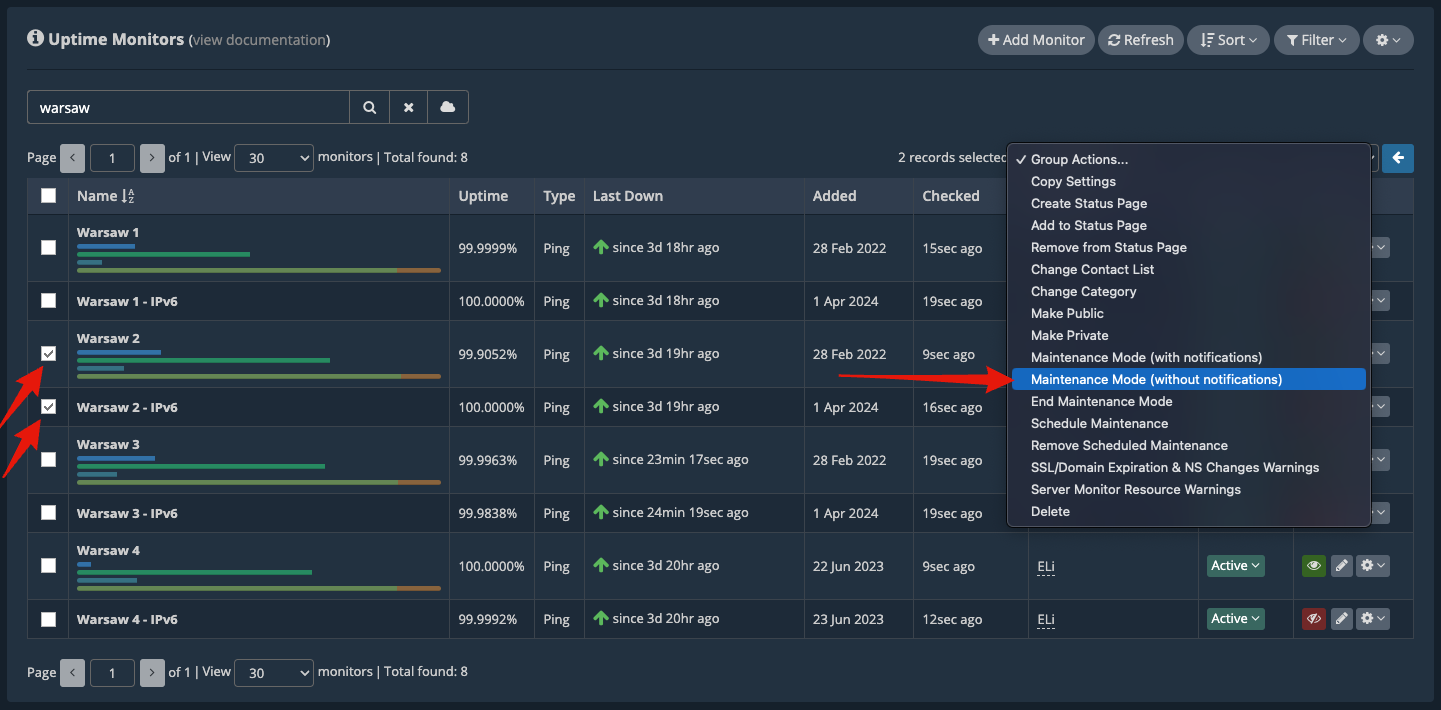
We’ll be working on the server “Warsaw 2”. So, we first place this server under “Maintenance Mode (without notifications)” by using Group Actions. We’re performing this action so that there won’t be any notifications issued for any downtime caused by this maintenance due to server reboots or other factors. Our system will classify downtimes differently if the uptime monitor is under “Maintenance Mode”.
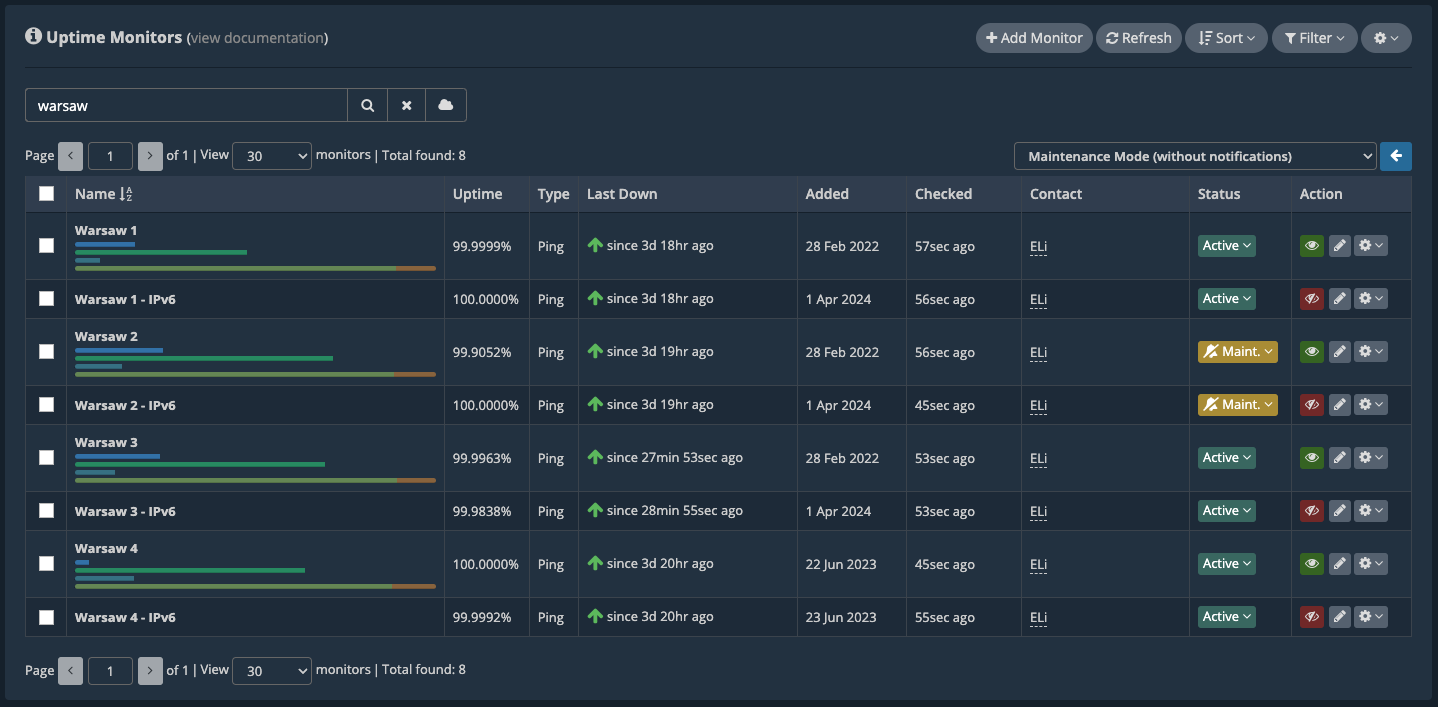
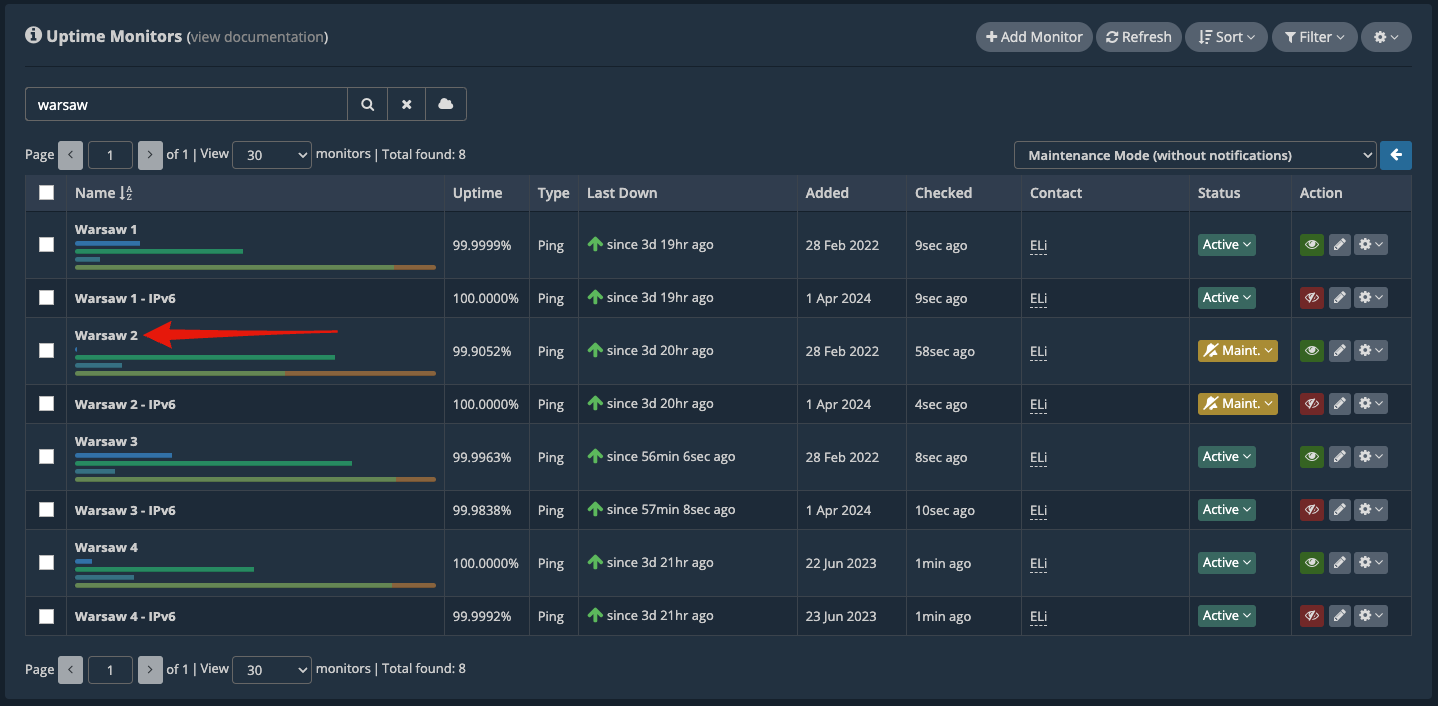
Now, the “Warsaw 2” uptime monitors are placed under Maintenance Mode.
The “Warsaw 2” monitoring node is still in use by our system, being assigned processing load, as can be seen from its CPU usage.
We can now turn off the load for this monitoring node from our back-end, so it won’t process any more uptime checks as we perform the maintenance on the server. Our dashboard is completely responsive and updates its data in real time; you won’t have to keep refreshing the page to view any changes. Once the processing load has been turned off for the “Warsaw 2” monitoring node, you can see its CPU usage go down in real-time in your dashboard.
Now, we click on the “Warsaw 2” uptime monitor name to open its server metrics.
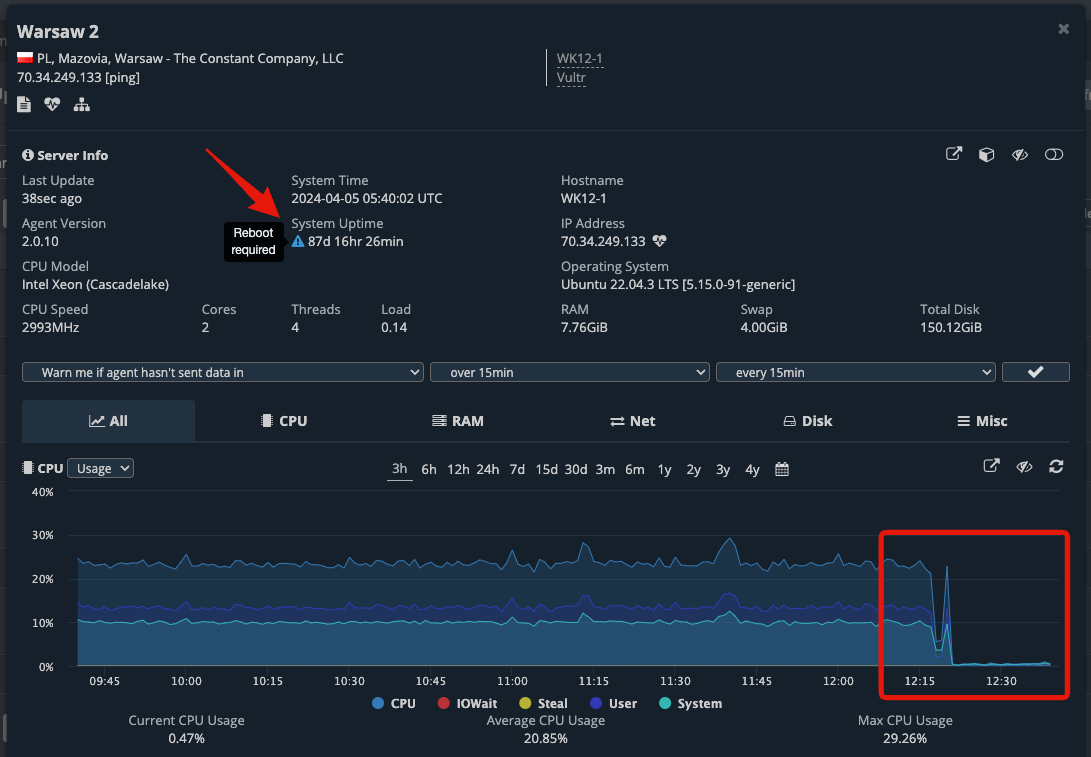
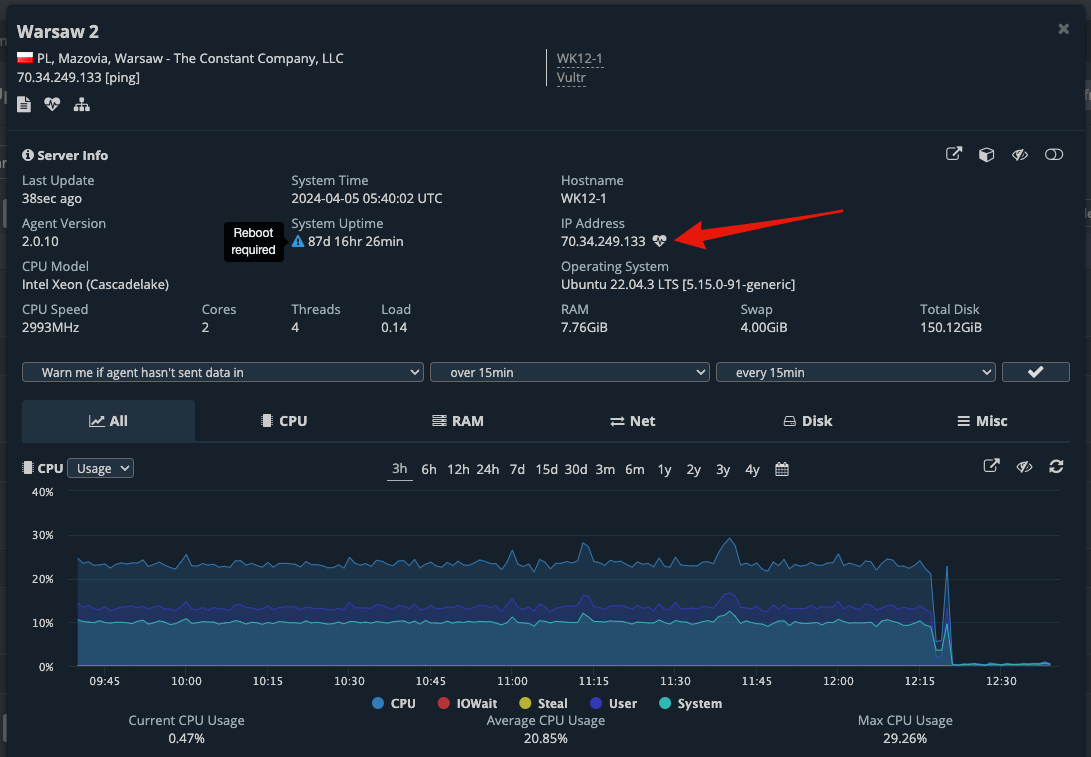
In the pop-up modal with the server metrics, we can easily notice that this server is due for a reboot after installing the latest updates. Our agent automatically figures out if your server needs a reboot, and displays this icon in your dashboard. You can also notice on the CPU usage graph the moment we turned off the processing load for this monitoring server, and the usage dropped to almost 0%.
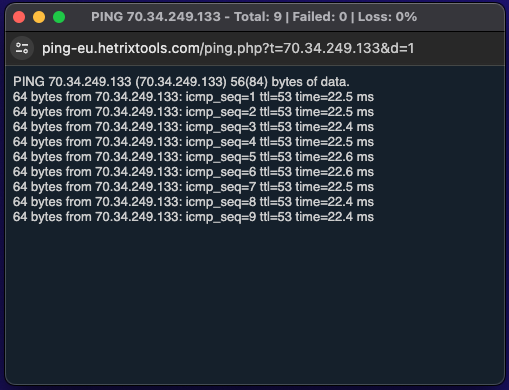
Given that we’ll have to perform a server reboot for this node, we’ll now quickly open a PING window to see exactly when the server goes down and comes back up again, just as you would ping the server’s IP from your own terminal. This Quick PING feature is provided by our platform so you won’t have to go through the trouble of opening your own terminal window and copy/paste the server’s IP address in there.
As the Quick PING window opens up in a different, smaller browser window, we can drag this off to the side of the screen or onto a different screen to keep an eye on it.
After installing the updates and performing other tasks on the server, it’s time to reboot the “Warsaw 2” monitoring node. Once we initiate the reboot from the server’s terminal, our platform will show the “Warsaw 2” uptime monitors as being ‘DOWN’ in your dashboard.

Once the server comes back online, you can see it in real-time in your Quick PING window, and shortly after in your uptime monitors dashboard as well.
Now that the server is back online, we can disable the “Maintenance Mode” from the uptime monitors dashboard.

Double-check the server after the reboot, and then everything will be ready to put this node back into production. After turning the processing load back on for the “Warsaw 2” server, you can see the increasing CPU usage for this node in your uptime monitors dashboard in real-time.
The maintenance is now complete, and everything is back to normal.
We use our own platform to monitor and manage our non-impacting infrastructure, and we absolutely love it. That’s why we put so much thought and care into all of our features: we need to use them ourselves.